Resumindo:
- Volatility measures the dispersion of asset returns, indicated by the annualized standard deviation of price changes. It signals both risk and opportunity but does not necessarily predict market direction or crashes. Traders use tools like the VIX, implied volatility, and diversification strategies to assess and manage market fluctuations effectively.
Volatility is defined as the statistical measure of dispersion of an asset’s returns around its mean, expressed as the annualized standard deviation of price changes. Every trader and investor encounters it, yet few understand it well enough to use it as an advantage. Volatility signals both risk and opportunity. Firms like Vanguard and tools like the CBOE Volatility Index (VIX) have built entire frameworks around reading and responding to it. This guide breaks down how volatility works, how to measure it, what drives it, and how to factor it into your trading decisions.
What is volatility and how is it measured?
Volatility in finance has one core definition: the degree to which an asset’s price moves up or down over a given period. The wider those swings, the higher the volatility. The narrower, the lower. Standard deviation is the primary metric. It tells you how far prices typically deviate from their average over a set timeframe.

To annualize volatility, traders multiply the standard deviation by the square root of the number of trading periods in a year. For stocks, that means multiplying by the square root of 252, the standard count of trading days. This converts daily price variation into a figure you can compare across assets and timeframes.
Beyond standard deviation, two major forms of volatility matter to most traders.
| Volatility Type | What It Measures | How It’s Calculated |
|---|---|---|
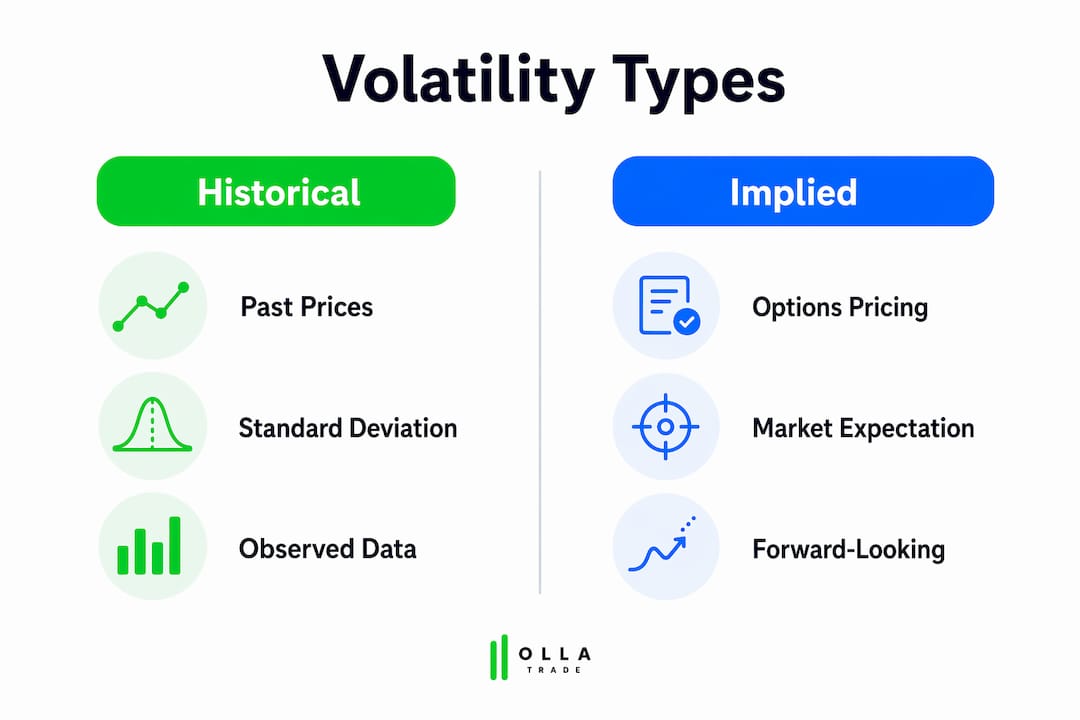
| Historical Volatility | Past price variation over a defined period | Standard deviation of past returns |
| Implied Volatility | Expected future price variation | Derived from options pricing models like Black-Scholes |
| Beta | Price movement relative to a benchmark index | Covariance of asset returns vs. index returns |
Historical and implied volatility each serve a different purpose. Historical volatility tells you what happened. Implied volatility tells you what the market expects to happen next. Beta adds context by showing how volatile an asset is compared to a benchmark like the S&P 500. A Beta above 1.0 means the asset moves more than the index. Below 1.0 means it moves less.
Dica profissional: Never rely on historical volatility alone when pricing options or assessing near-term risk. Implied volatility reflects current market sentiment and often diverges sharply from historical readings during earnings seasons or major economic events.
What causes volatility in financial markets?
Market volatility arises from a combination of macroeconomic events, investor sentiment, liquidity conditions, and the structure of the market itself. No single factor controls it. Instead, these forces interact and amplify each other, especially during periods of stress.
Here are the primary drivers and their market effects:
- Macroeconomic data releases. Reports on inflation, employment, and GDP growth shift expectations about interest rates and corporate earnings. Surprises in either direction trigger rapid repricing.
- Central bank decisions. Federal Reserve announcements on rate changes or forward guidance move bond and equity markets simultaneously. Uncertainty before a decision often raises volatility more than the decision itself.
- Geopolitical events. Wars, trade disputes, and political instability reduce investor confidence and compress liquidity, which amplifies price swings.
- Market liquidity. Thin trading volumes mean fewer buyers and sellers are available to absorb large orders. This causes prices to move more sharply on the same amount of activity.
- Investor behavior and sentiment. Fear and greed drive herding. When traders react to the same news in the same direction at the same time, price moves become exaggerated.
One common misconception is that high volatility predicts a market crash. Volatility reflects uncertainty but does not necessarily predict market direction. A highly volatile market can move sharply upward just as easily as downward. Treating volatility as a directional signal leads to poor decisions.
How does volatility shape investment and trading strategies?
Volatility plays a central role in both risk management and asset pricing. Its impact differs significantly depending on your time horizon and goals.
Long-term investors, the type Vanguard advises, often view high volatility as an opportunity to rebalance portfolios at better prices. A sharp drawdown in equities lets them buy more shares at lower valuations without changing their long-term thesis. Active traders, by contrast, see volatility as the engine of short-term profit. Without price movement, there is no opportunity to capture gains.
Diversification is the most reliable structural defense against volatility risk. Combining low-correlation assets reduces overall portfolio swings because losses in one asset class are partially offset by stability or gains in another. UBS research on multi-asset portfolios consistently points to the volatility-correlation interplay as the key variable for smoother performance over time.
Strategies aligned with different volatility regimes include:
- Low volatility environment: Trend-following strategies work well. Prices move steadily in one direction with fewer reversals.
- High volatility environment: Mean-reversion strategies gain an edge. Prices overshoot and snap back more frequently.
- Options trading: Higher volatility raises option premiums due to greater expected price moves. Selling options in high-volatility periods can generate income, though it carries significant risk.
- Position sizing: Reduce position sizes during high-volatility periods to keep dollar risk per trade consistent. This is a core principle in sound gestão de risco de negociação.
Entender como indices shape portfolio diversification is equally useful when building a volatility-aware strategy across asset classes.
Dica profissional: Staying invested during volatile periods is historically more profitable than moving to cash. Timing the market around volatility spikes means you risk missing the sharpest recovery days, which often cluster immediately after the worst sell-offs.
What tools and indicators help you monitor volatility?
Traders use several dedicated tools to measure and forecast market volatility. Each serves a distinct function.
The VIX index, published by the CBOE, is the most widely recognized. VIX measures implied volatility of S&P 500 options over a 30-day window. A VIX reading above 30 signals elevated fear and uncertainty. Below 20 suggests relative calm. Traders call it the “fear index” because it spikes sharply during market stress events like the 2008 financial crisis or the March 2020 COVID-19 selloff.
The Chaikin Volatility indicator measures the spread between an asset’s high and low prices over a rolling period. It identifies whether volatility is expanding or contracting, which helps traders anticipate potential breakouts or reversals.
Implied volatility, derived from options pricing models like Black-Scholes, is particularly useful for options traders. Greater volatility raises option values because a wider expected price range increases the probability that the option will expire in the money. Monitoring implied volatility relative to historical volatility reveals whether the market is pricing in more or less uncertainty than past behavior suggests.
| Indicador | Primary Use | Ideal para |
|---|---|---|
| VIX Index | Measures S&P 500 implied volatility over 30 days | Gauging overall market fear and sentiment |
| Chaikin Volatility | Tracks high-low price spread over rolling periods | Identifying expanding or contracting volatility |
| Implied Volatility (IV) | Expected future price variation from options pricing | Options strategy selection and premium assessment |
| Historical Volatility (HV) | Past realized price variation | Benchmarking current volatility against prior periods |
| Beta | Asset volatility relative to a benchmark | Portfolio construction and risk calibration |
Comparing implied volatility to historical volatility gives you a practical edge. When implied volatility is significantly higher than historical volatility, the market is pricing in more uncertainty than recent history justifies. That gap often represents a premium that options sellers can capture. When implied volatility is lower than historical volatility, options may be underpriced relative to actual market behavior.
Usando ferramentas avançadas de criação de gráficos alongside these indicators lets you overlay volatility readings directly onto price action, making it easier to spot patterns and time entries.
Principais conclusões
Volatility is a measurable, manageable feature of financial markets, not a threat to avoid but a variable to understand and use.
| Apontar | Detalhes |
|---|---|
| Definição principal | Volatility measures the statistical dispersion of asset returns, expressed as annualized standard deviation. |
| Two key types | Historical volatility tracks past price swings; implied volatility reflects market expectations of future moves. |
| Main causes | Macroeconomic events, central bank decisions, liquidity conditions, and investor sentiment all drive volatility. |
| Strategy impact | Long-term investors use volatility to rebalance; active traders use it to capture short-term price moves. |
| Essential tools | VIX, Chaikin Volatility, and implied volatility indicators each serve a distinct role in monitoring market conditions. |
Volatility is not your enemy. misreading it is.
Most traders I’ve watched struggle with volatility share the same problem. They treat it as a signal to act when it’s actually a condition to read. Volatility tells you the market is uncertain. It does not tell you which direction prices will move.
The distinction between volatility and risk is one that took me time to fully internalize. Volatility is price movement magnitude. Risk is the probability of permanent capital loss. A stock that swings 5% daily is volatile. It is not automatically risky if you understand the business, size your position correctly, and have a clear exit plan. Conflating the two leads to panic selling at exactly the wrong moment.
The emotional side of volatility is real. Watching a position drop 10% in a session triggers a physiological stress response. The traders who manage this best are not the ones who feel nothing. They are the ones who have a written plan they follow regardless of how they feel. Position limits, stop-loss levels, and rebalancing rules all exist to remove emotion from the equation.
Managing volatility is less about avoiding it and more about calibrating your exposure to your actual risk tolerance. A diversified portfolio built around your time horizon handles volatility far better than any attempt to time the market around it. The traders who consistently perform well are not the ones who predict volatility spikes. They are the ones who have already decided what they will do when those spikes arrive.
— FX
Trade volatile markets with confidence on Ollatrade
Volatility creates opportunity, but only for traders who have the right tools and knowledge behind them. Ollatrade gives you access to negociação forex across major, minor, and exotic pairs, along with CFDs on metals, indices, energies, and cryptocurrencies. Every instrument is available with tight spreads and fast execution through MetaTrader 4.
Beyond the platform itself, Ollatrade provides an calendário econômico to track the macro events that drive volatility, a full Glossário de Forex for building your foundational knowledge, and risk management guides built for traders at every level. Whether you are reading your first VIX chart or refining a multi-asset strategy, Ollatrade has the resources to support your next move.
Perguntas frequentes
What is volatility in simple terms?
Volatility measures how much and how quickly an asset’s price moves over time. High volatility means large, rapid price swings; low volatility means prices move slowly and steadily.
How is volatility different from risk?
Volatility measures the magnitude of price movement, while risk refers to the probability of permanent capital loss. A volatile asset is not automatically a risky one if position sizing and exit rules are in place.
What does the VIX index measure?
The VIX measures the implied volatility of S&P 500 options over a 30-day period. Readings above 30 signal elevated market fear; readings below 20 indicate relative calm.
Does high volatility mean the market will crash?
No. High volatility reflects uncertainty, not direction. Markets can move sharply upward during high-volatility periods just as easily as they can fall.
How can traders use volatility in their strategy?
Traders adjust position sizes, select options strategies based on implied volatility levels, and use indicators like VIX and Chaikin Volatility to time entries and exits more effectively.