Resumindo:
- Effective market analysis combines fundamental, technical, and sentiment methods to improve trading decisions. Mastering each pillar sequentially over time helps traders develop a comprehensive approach. Relying on all three minimizes errors and enhances prediction accuracy across various markets.
Financial market analysis is the process of evaluating market data through three core lenses — fundamental, technical, and sentiment — to forecast price movements and make informed trading decisions. Most retail traders pick one method and ignore the others. That single mistake costs them more than any bad trade ever will. This guide walks you through each analytical pillar, shows you how to apply them step by step, and explains how combining all three produces sharper, more reliable decisions across forex, stocks, indices, and commodities.
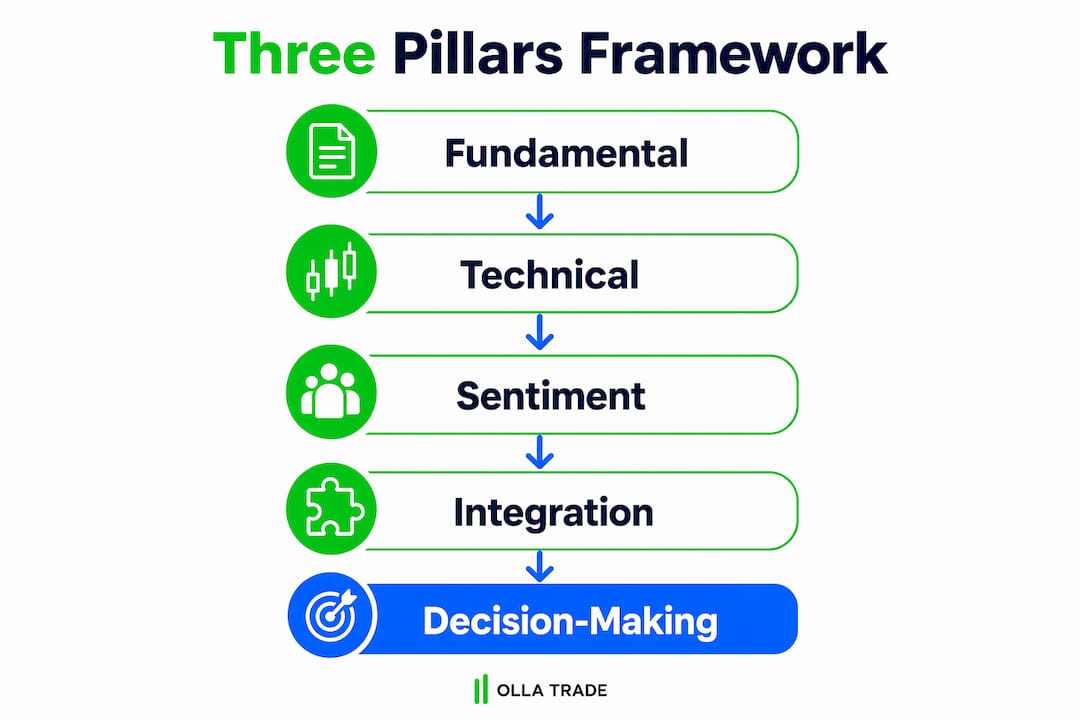
How to analyze financial markets: the three-pillar framework
Financial market analysis is best structured around three core pillars: fundamental analysis, technical analysis, and sentiment analysis. Each pillar answers a different question. Fundamentals tell you o que to trade. Technicals tell you quando to trade it. Sentiment tells you whether the crowd is positioned in a way that confirms or contradicts your view.
Traders who master all three gain a significant edge. Those who rely on only one are flying with one instrument. The good news is that you do not need to become an expert in all three at once. You build them sequentially, and the skills compound over time.
What is fundamental analysis and how do you apply it?
Fundamental analysis evaluates the intrinsic value of an asset by examining economic data, company financials, and macroeconomic conditions. The goal is to determine whether an asset is overvalued, undervalued, or fairly priced relative to its actual economic reality.
Fundamental analysis uses financial statements and macro data to determine intrinsic value. For stock traders, that means reading income statements, balance sheets, and cash flow statements. For forex traders, it means tracking GDP growth, inflation rates, central bank interest rate decisions, and manufacturing PMI readings.
Here is a practical step-by-step process to apply fundamental analysis:
- Gather macro data. Start with the big picture. Pull GDP growth rates, inflation figures, and central bank policy statements for the economy or sector you are analyzing. Ollatrade’s calendário econômico is a reliable starting point for tracking scheduled data releases.
- Identify key financial ratios. For equities, calculate the price-to-earnings (P/E) ratio, PEG ratio, return on equity, and debt-to-equity ratio. These metrics reveal whether a stock trades at a premium or discount to its peers.
- Assess geopolitical context. Trade disputes, elections, and central bank policy shifts all move markets. A strong GDP print means little if a surprise rate hike is about to drain liquidity from equities.
- Compare against market price. If your analysis shows a stock’s intrinsic value is $80 but it trades at $55, that gap is your signal. The same logic applies to currency pairs when one economy clearly outperforms another.
- Revisit your assumptions regularly. Macro conditions shift. A thesis built on low inflation breaks down the moment CPI surprises to the upside.
Dica profissional: Start your fundamental research with the beginner’s guide to fundamental analysis before diving into individual ratios. Understanding the framework first prevents you from misreading data in isolation.
A common beginner mistake is treating a single strong earnings report as a buy signal. One quarter of good data does not override a deteriorating macro backdrop. Always read individual data points inside the larger economic picture.
How to conduct technical analysis to identify trading opportunities
Technical analysis examines price action, chart patterns, and momentum indicators to identify trends and time trade entries and exits. It does not predict the future. It identifies high-probability setups based on how price has behaved historically under similar conditions.
The core tools every trader needs to know:
- Moving averages. The 50-day and 200-day simple moving averages (SMA) define trend direction. When price trades above the 200 SMA, the long-term trend is bullish. A crossover of the 50 SMA above the 200 SMA, called a “golden cross,” signals a potential trend shift.
- RSI (Relative Strength Index). RSI measures momentum on a scale of 0 to 100. Readings above 70 suggest overbought conditions. Readings below 30 suggest oversold conditions. RSI divergence, where price makes a new high but RSI does not, is one of the most reliable reversal signals in technical analysis.
- MACD (Moving Average Convergence Divergence). MACD tracks the relationship between two exponential moving averages. A bullish crossover of the MACD line above the signal line confirms upward momentum. Traders use it to confirm trend direction before entering a position.
- Bollinger Bands. These bands expand during high volatility and contract during low volatility. Price touching the upper band in a strong uptrend is not automatically a sell signal. Context matters.
- Chart patterns. Head-and-shoulders formations signal trend reversals. Triangles and flags signal continuation. These patterns work best when confirmed by volume and a supporting indicator like RSI or MACD.
Multi-timeframe analysis and combining indicators enhance reliability. A setup that looks strong on a 15-minute chart but contradicts the daily trend is a low-quality trade. Always check the higher timeframe first.
Dica profissional: Never stack three indicators that measure the same thing. RSI, Stochastic, and CCI all measure momentum. Pick one. Pair it with a trend indicator like a moving average and a volatility measure like ATR or Bollinger Bands. That combination covers three different dimensions of price behavior without redundancy.

For a deeper technical framework, Ollatrade’s guide on análise técnica forex covers advanced price structure concepts that go well beyond basic indicator setups.
Using sentiment analysis to gauge market psychology
Sentiment analysis measures the emotional state of the market by tracking how traders and institutions are positioned. It answers a question that fundamentals and technicals cannot: is the crowd already priced in for the move you are expecting?
Sentiment tools like Commitment of Traders (COT) reports, put/call ratios, and volatility indices are key inputs for measuring crowd behavior. When sentiment reaches an extreme, the market is often about to reverse. This is because extreme positioning means most participants have already acted on their view. There is no one left to push the trade further.
Here is a step-by-step approach to monitoring sentiment:
- Read the COT report weekly. The Commodity Futures Trading Commission (CFTC) publishes the Commitment of Traders report every Friday. It shows how commercial hedgers, large speculators, and small traders are positioned. When large speculators are historically net long at extreme levels, a reversal is often near.
- Track the put/call ratio. A high put/call ratio means traders are buying more puts than calls, signaling fear. Contrarian traders read extreme fear as a potential buying opportunity.
- Monitor implied volatility. The VIX index measures expected volatility in the S&P 500. A VIX spike above 30 often coincides with market bottoms, not tops. Fear peaks at the worst moment for the crowd.
- Use fear and greed indices. CNN’s Fear and Greed Index aggregates seven market indicators into a single score. Readings below 20 signal extreme fear. Readings above 80 signal extreme greed. sentimentos extremos often precede trend reversals.
Sentiment analysis is most powerful when it contradicts the prevailing narrative. If every financial news outlet is calling for a market crash and the COT report shows commercial hedgers aggressively buying, that divergence is worth paying attention to.
How to integrate all three methods into one framework
The real edge in market analysis comes from combining all three pillars into a single decision-making framework. Matching analysis method to the market question improves forecast accuracy. Using the wrong tool for the wrong question produces noise, not signal.
The table below shows how each method maps to a specific trading need:
| Tipo de análise | Melhor utilizado para | horizonte temporal | Ferramentas essenciais |
|---|---|---|---|
| Fundamental | Asset selection, macro direction | Semanas a meses | GDP, P/E ratio, interest rates, PMI |
| Técnico | Trade timing, entry and exit | Minutes to weeks | RSI, MACD, moving averages, chart patterns |
| Sentimento | Positioning check, reversal timing | Dias a semanas | COT reports, VIX, put/call ratio, Fear and Greed Index |
A practical workflow looks like this. Start with macro fundamentals to identify which assets or currency pairs have a directional bias. A country with rising interest rates and strong GDP growth typically has a strengthening currency. Then check sentiment to confirm the crowd is not already fully positioned for that move. Finally, use technical analysis to time your entry at a level with a favorable risk-to-reward ratio.
Advanced market analysis relies on frameworks connecting macroeconomic regimes to cross-asset behavior. For example, rising bond yields typically pressure growth stocks. Tracking that stock-bond correlation gives you context that no single chart pattern can provide.
The most common mistake traders make is switching methods when one stops working. Fundamentals do not work on a five-minute chart. Technicals do not tell you whether a company is solvent. Respect the purpose of each tool and use it accordingly.
Building skills across all three pillars typically requires 6–18 months of focused practice. That timeline is not discouraging. It is clarifying. It tells you that market analysis is a learnable skill, not a talent you either have or do not.
Principais conclusões
Effective financial market analysis requires combining fundamental, technical, and sentiment methods because each pillar answers a different question that the others cannot.
| Apontar | Detalhes |
|---|---|
| Use all three pillars | Fundamental, technical, and sentiment analysis each solve a different part of the trading puzzle. |
| Match method to question | Use fundamentals for asset selection, technicals for timing, and sentiment for positioning checks. |
| Avoid indicator redundancy | Combine tools that measure different dimensions: trend, momentum, and volatility. |
| Sentiment signals reversals | Extreme COT positioning or VIX spikes often precede trend changes before charts confirm them. |
| Expect a learning curve | Building competency across all three methods takes 6–18 months of consistent, focused practice. |
What I have learned after years of watching traders get this wrong
Most traders I have observed do not fail because they lack intelligence. They fail because they treat one analysis method as a complete system. I have seen technically skilled traders blow up accounts because they ignored a macro shift that any fundamental reading would have flagged. I have also seen fundamentally sound investors hold losing positions for months because they never learned to read a chart.
The uncomfortable truth is that no single method is a crystal ball. Intermarket relationships, such as stock-bond correlations and global capital flows, offer insights that neither a P/E ratio nor an RSI reading can provide alone. The traders who last are the ones who think in systems, not signals.
My honest advice: spend your first three months learning fundamentals. Spend the next three on technicals. Then layer in sentiment. Do not try to master all three simultaneously. The frameworks need to settle in your thinking before you can combine them fluidly. And when a trade feels obvious to everyone, that is usually the moment sentiment analysis saves you from a very expensive mistake.
— FX
Put your analysis skills to work with Ollatrade
Understanding how to evaluate stock markets and time trades is only half the equation. You need a platform that gives you the tools to act on your analysis in real time.
Ollatrade provides integrated charting tools, technical indicators, and a live economic calendar so you can track fundamental data releases the moment they hit. The platform supports MetaTrader 4, giving you access to custom indicators, expert advisors, and multi-timeframe charts across forex, CFDs, metals, indices, and cryptocurrencies. Whether you are applying your first fundamental screen or running a multi-timeframe technical setup, Ollatrade’s plataforma de negociação forex is built to support every step of your analysis workflow. Create your account today and start trading with the tools that match your method.
Perguntas frequentes
What are the three main financial market analysis techniques?
The three core techniques are fundamental analysis, technical analysis, and sentiment analysis. Each method addresses a different aspect of market evaluation: valuation, timing, and crowd positioning.
How long does it take to learn how to analyze markets effectively?
Building competency across fundamental, technical, and sentiment analysis typically takes 6–18 months of focused study and practice. Most traders see meaningful improvement after consistently applying one method for at least 90 days before adding the next.
Can AI tools help with financial market analysis?
AI tools like ChatGPT can perform news and sentiment analysis to assist with data interpretation, but they work best as supplements to your own analysis framework. They are not a replacement for understanding the underlying methods.
What is the best indicator for timing trade entries?
No single indicator is best for all situations. RSI divergence and MACD crossovers are widely used for timing entries, but they are most reliable when confirmed by the higher-timeframe trend and a supporting sentiment reading.
How do beginners start learning to evaluate stock markets?
Comece com fundamental analysis basics to understand valuation concepts, then move to technical analysis for chart reading skills. Add sentiment tools last, once you can read price action and economic data with confidence.