












TL;DR:
- Chart patterns offer an 80% success rate when confirmed properly, reflecting collective trader psychology.
- Proper trade entry involves waiting for volume-confirmed breakouts and retests, not impulsive guesses.
- Combining patterns with volume, trend analysis, and confluence tools significantly improves trading reliability.
Most traders assume chart patterns are little more than drawing lines on a screen and hoping for the best. That assumption is expensive. The reality is that certain patterns like the Head & Shoulders show roughly 80% success rates after confirmation, turning what looks like art into a probabilistic edge. Chart patterns are not magic, but they are a structured way to read what the crowd is doing with their money. In this guide, you will learn how to identify the most reliable patterns, apply them in Forex and crypto markets, and avoid the mistakes that wipe out the statistical advantage before it ever pays off.
Table of Contents
- What are chart patterns and why do they matter?
- How to identify and trade chart patterns step by step
- Trading chart patterns in Forex vs. crypto markets
- Avoiding common pitfalls: Pattern failures, false breakouts, and edge cases
- Why chart patterns work—and when they don’t: An expert’s take
- Take your trading to the next level with Olla Trade
- Frequently asked questions
Key Takeaways
| Point | Details |
|---|---|
| Patterns mirror market psychology | Chart patterns visually capture supply-demand shifts and crowd sentiment for better trading decisions. |
| Confirmation is essential | Always confirm patterns with breakout volume and a price retest before entering trades. |
| Adapt to your market | Tailor your use of chart patterns to volatility and timeframes in Forex versus cryptocurrency markets. |
| Manage risk, not just entry | Use stops, targets, and confluence indicators together for improved reliability and long-term success. |
| No single pattern guarantees profit | Chart patterns increase your probabilities but require context and discipline to realize their potential. |
What are chart patterns and why do they matter?
At their core, chart patterns are repeating formations on a price chart that signal likely future price movement. They are not predictions. They are probabilities shaped by collective trader behavior, large institutional orders, and the push and pull between buyers and sellers. Understanding them starts with recognizing what they actually represent.
Chart patterns serve as visual representations of price action reflecting market psychology, supply-demand imbalances, and trader sentiment, sorted into reversal, continuation, and bilateral types. That categorization matters a great deal in practice.
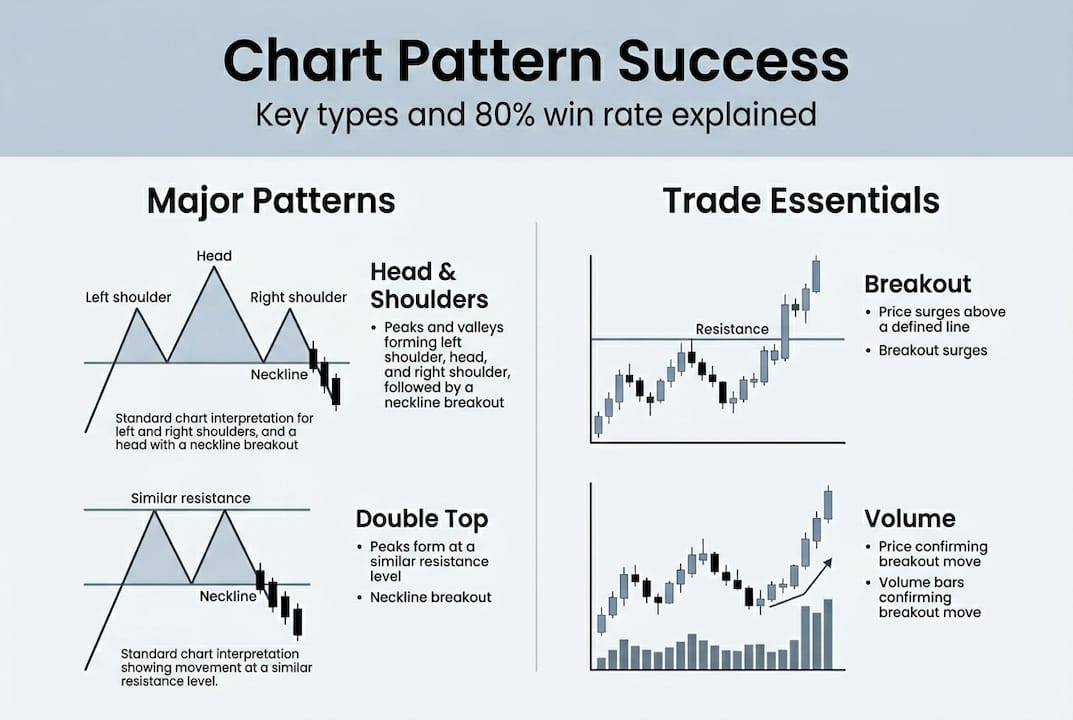
Here is how the three main chart pattern categories break down:
| Pattern type | What it signals | Examples |
|---|---|---|
| Reversal | Trend about to change direction | Head & Shoulders, Double Top, Double Bottom |
| Continuation | Trend likely to resume | Flags, Pennants, Ascending Triangles |
| Bilateral | Could break either way | Symmetrical Triangle, Wedge |
The biggest misconception traders carry is that these formations are subjective. In reality, specific rules govern each pattern: minimum number of touches, price structure requirements, and volume behavior. When you follow those rules, you filter out noise.
Why do patterns form in the first place? Because human beings react to price levels the same way, over and over. When price approaches a previous high and stalls, traders who bought there before get nervous and sell. New buyers hesitate. That tension creates a recognizable shape on the chart. Trading psychology basics sit at the foundation of every pattern you will ever trade.
Here are the key reasons patterns matter for active traders:
- They give you a structured entry point instead of a gut feeling
- They define where you are wrong, which makes stop placement logical
- They provide a measured target based on pattern geometry
- They work across all timeframes and liquid markets, including crypto trading strategies
“A chart pattern without volume context is a story without an ending. The shape tells you the setup; the volume tells you whether it’s real.”
Patterns are not infallible. But they give you a framework that random entries simply cannot match.
How to identify and trade chart patterns step by step
Recognizing a pattern on a chart is only half the job. The other half is trading it correctly without forcing entries or jumping the gun. Let’s break this down into a repeatable process.
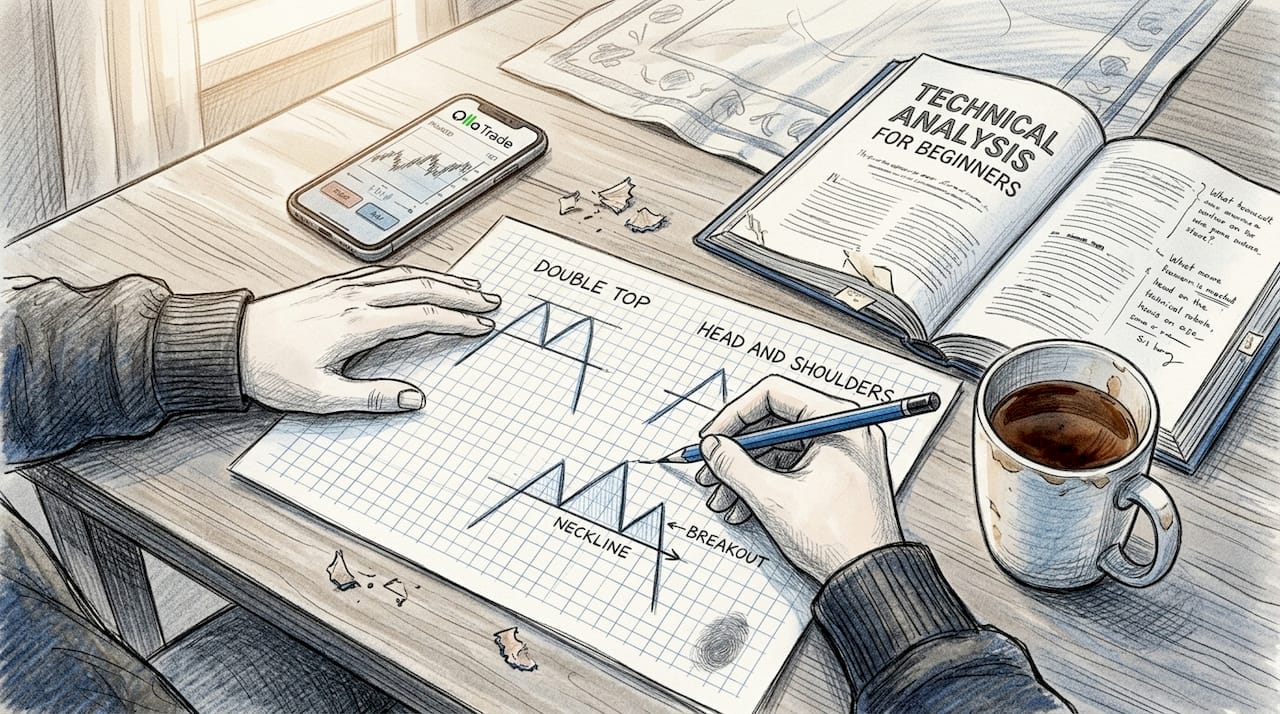
The mechanics of trading patterns involve identifying the formation, waiting for a breakout confirmed with a volume surge, entering on the retest of the broken level, setting a stop beyond the pattern boundary, and projecting a price target based on pattern height. Every step matters.
Here is the step-by-step process:
- Identify the pattern on a clean candlestick or bar chart. Mark the key highs, lows, and necklines clearly.
- Wait for the breakout. Do not enter while price is still inside the pattern. The breakout candle should close outside the boundary.
- Confirm with volume. A breakout on low volume is a red flag. Look for above-average volume on the breakout candle.
- Enter on the retest. After breakout, price often pulls back to the broken level. This retest gives you a lower-risk entry with a tighter stop.
- Set your stop loss just beyond the pattern boundary or the last swing point inside the pattern.
- Project your target by measuring the pattern’s height and adding (or subtracting) it from the breakout point.
Here is a quick reference for common patterns and their typical reliability:
| Pattern | Avg. reliability | Best timeframe |
|---|---|---|
| Head & Shoulders | ~80% | Daily, 4H |
| Double Top / Bottom | ~75% | Daily, 4H |
| Bull Flag | ~67% | 1H, 4H |
| Symmetrical Triangle | ~60% | 4H, Daily |
Learning to read stock charts accurately is the foundation for all of this. If your chart is cluttered with indicators, you will miss the pattern structure entirely.
Pro Tip: Use a plain candlestick chart with no indicators when identifying patterns for the first time. Add volume as the only overlay. This forces you to see what price is actually doing rather than what an indicator says it might do.
The biggest pitfalls to avoid are forcing a pattern that is not clearly there, ignoring volume on the breakout, and entering before confirmation. Review your trading strategies guide to see how patterns fit inside a broader system. You can also use trading signals as a secondary filter to validate your own pattern reads.
Trading chart patterns in Forex vs. crypto markets
Both Forex and crypto traders rely on chart patterns. The underlying logic is identical: price action reflects crowd psychology, and crowds repeat themselves. The differences come down to volatility, liquidity, and how often patterns complete cleanly.
In Forex and crypto, patterns apply similarly, but crypto shows significantly more volatility, favoring sharper breakouts. Higher timeframes are more reliable in both markets, and multi-timeframe analysis combined with Fibonacci levels filters the highest-probability setups.
Here is a direct comparison:
| Factor | Forex | Crypto |
|---|---|---|
| Volatility | Lower, more predictable | Higher, more erratic |
| False breakouts | Less common | More frequent |
| Pattern completion speed | Slower, more gradual | Faster, often sharper |
| Best timeframes | 4H, Daily | Daily, Weekly |
| Volume data reliability | Limited (decentralized) | More accessible on exchanges |
The Forex vs. crypto comparison reveals a key insight: crypto’s 24/7 market structure means patterns can break at any time, including during low-liquidity windows when false signals are most likely.
Here is how to adapt your approach for each market:
- In Forex, focus on 4H and Daily patterns during the London and New York sessions when liquidity is highest
- In crypto, move up to the Daily and Weekly chart to filter out the noise from retail speculation
- Use Fibonacci retracement levels at 38.2% and 61.8% to pinpoint entry zones within a confirmed pattern
- Look for confluence: pattern structure aligning with a moving average, a key support level, or a Fibonacci zone
Confluence is what separates amateur pattern trading from professional pattern trading. One signal is a guess. Three signals agreeing is an edge. Study forex strategy examples and compare them against crypto market strategies to see how different the execution looks in practice despite the same underlying logic.
Avoiding common pitfalls: Pattern failures, false breakouts, and edge cases
Even textbook-perfect patterns fail. Knowing why they fail is just as important as knowing how to trade them.
Statistics are sobering here. Lack of volume on a breakout reduces pattern reliability by roughly 35%, and reversal patterns frequently fail when they form against a dominant, strong trend. These are not rare edge cases. They are the norm for traders who skip confirmation steps.
The three core reasons patterns fail:
- No volume on breakout. The move is not backed by real participation. It fakes out and reverses.
- Trading against the dominant trend. A bearish reversal pattern in a raging bull market needs much stronger evidence to be credible.
- Premature entry. Entering while price is still inside the pattern exposes you to full pattern risk with none of the confirmation advantage.
Pro Tip: Treat every breakout as guilty until proven innocent. Wait for the candle to close outside the pattern boundary AND see volume spike before you consider an entry. Patience here is a genuine statistical advantage.
Edge cases worth knowing:
- Parabolic crypto moves invalidate most pattern targets because price overshoots dramatically. Tighten your targets or trail your stop.
- News-driven volatility can destroy a pattern setup instantly. Check the economic calendar before trading any pattern near a major data release.
- Candlestick pattern reliability drops sharply on lower timeframes, especially in crypto, where a single large order can create a misleading signal.
Actionable steps to improve your reliability:
- Always confirm breakouts with volume before entering
- Cross-reference your pattern against the higher timeframe trend direction
- Use a fixed risk percentage per trade so a failed pattern never wrecks your account
- Keep a log of every pattern trade to track your personal success rate by type
Review trader best practices and keep the pattern cheat sheet handy when assessing new setups.
Why chart patterns work—and when they don’t: An expert’s take
Here is the uncomfortable truth most trading content skips: chart patterns tilt probabilities in your favor, but they are not prediction machines. Empirical research confirms that patterns offer statistical support in less efficient markets, while transaction costs and slippage erode that edge in highly mature, liquid ones.
The markets where patterns genuinely shine are early-stage crypto assets and volatile Forex pairs during high-impact news cycles. These environments are less efficient, meaning crowd psychology dominates price action more directly. In the ultra-liquid EUR/USD during calm sessions, the edge narrows.
What most traders get wrong is treating a pattern as a trade trigger on its own. It is not. It is one input. The real edge comes from stacking confluence: pattern structure plus volume confirmation plus higher timeframe alignment plus a sensible risk-reward ratio. Remove any one of those layers, and you are closer to gambling than trading.
A systematic approach beats a signal-chasing approach every time. The traders who profit from patterns long-term are not the ones who memorize the most shapes. They are the ones who build consistent rules, track their results rigorously, and stay disciplined when a setup does not meet their checklist. The pattern cheat sheet is a good starting point, but your own performance log is where real edge gets built.
Take your trading to the next level with Olla Trade
You now have a real framework for reading and trading chart patterns across Forex and crypto markets. The next step is putting it into practice on a platform built for serious traders.

Olla Trade gives you access to professional charting tools, tight spreads on Forex pairs and crypto markets, and MetaTrader 4 integration so you can apply everything you have learned here without technical friction. Whether you are refining your pattern recognition on a demo account or executing live setups with precision, the platform is built to support your workflow. Start with our forex trading guide to anchor your strategy, then open a demo and begin tracking real patterns in live market conditions today.
Frequently asked questions
Do chart patterns really work for trading?
Statistically, yes. Certain patterns like Head & Shoulders show up to 80% success after proper confirmation, particularly in volatile or less efficient markets where crowd psychology drives price more directly.
How do I confirm a valid chart pattern before trading?
Wait for a breakout with volume and then watch for a retest of the broken boundary before entering, as this two-step confirmation significantly cuts down on false signals.
Are chart patterns better for Forex or cryptocurrencies?
Both markets respond to patterns, but crypto’s higher volatility produces more frequent breakouts and false signals, so shifting to higher timeframes and using confluence tools is essential for filtering reliable setups.
What is the main reason chart patterns fail?
The most common cause is a low-volume breakout, which reduces reliability by roughly 35%, followed by trading against the dominant trend or entering the trade before the breakout is confirmed.
Can I use chart patterns alone to make trading decisions?
Patterns are strongest when combined with volume analysis, trend context, and risk management rules. Patterns provide structure but work as one component of a system, not as a standalone signal for entering trades.