สรุปโดยย่อ:
- Asset correlation measures the linear relationship between two financial instruments on a scale from -1 to 1. It is crucial for portfolio diversification because low or negative correlations reduce overall volatility during different market conditions. During crises, correlations tend to spike, eroding diversification benefits and increasing portfolio risk comprehensively.
Asset correlation is defined as a statistical measure of the linear relationship between two financial instruments, expressed on a scale from negative one to positive one. Understanding what is asset correlation gives you a direct edge in portfolio construction. When two assets move in perfect sync, their correlation is +1. When they move in exact opposition, it is -1. A reading near zero means no meaningful relationship exists. The Pearson correlation coefficient is the standard tool for calculating this relationship, and every serious investor needs to understand how to read it before making allocation decisions.
What is asset correlation and how is it calculated?
The Pearson correlation coefficient measures the degree to which two assets move together over a defined period. You calculate it by comparing the historical returns of two assets, then dividing their covariance by the product of their individual standard deviations. The result always falls between -1 and +1.
Here is how to interpret the three key reference points:
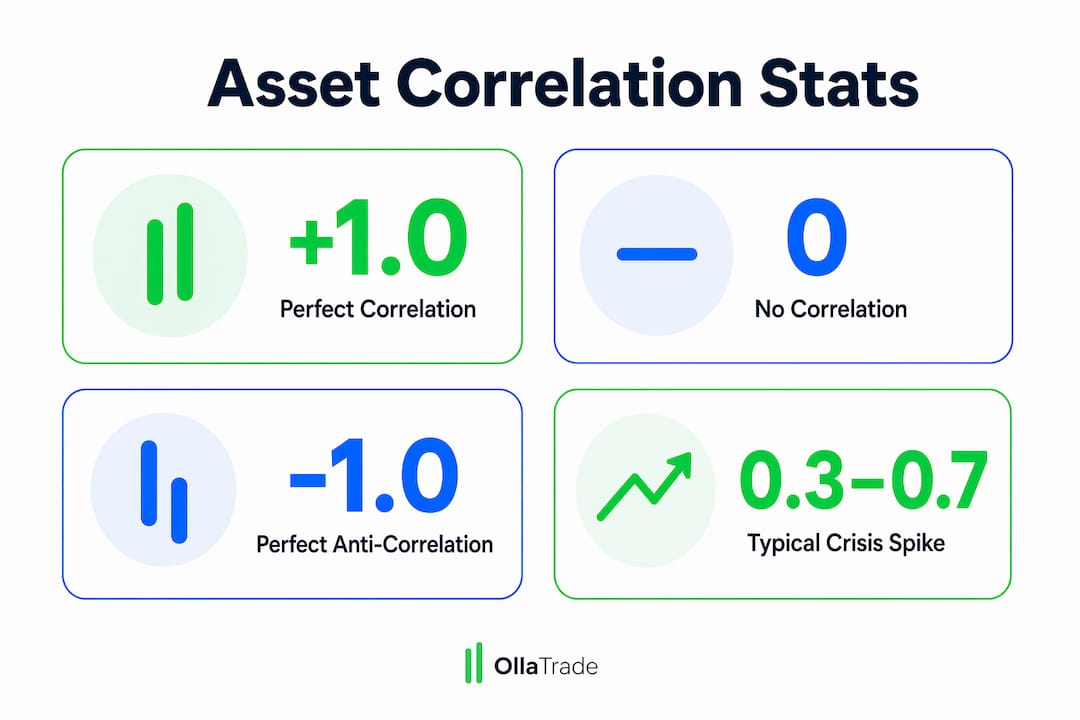
- +1 (perfect positive correlation): The two assets move in the same direction by the same magnitude at all times. Holding both adds no diversification benefit.
- 0 (zero correlation): The assets move independently of each other. Combining them reduces portfolio volatility without sacrificing expected return.
- -1 (perfect negative correlation): The assets move in exactly opposite directions. This is the theoretical ideal for hedging, though it rarely exists in practice.
Most real asset pairs fall somewhere between these extremes. U.S. stocks and Treasury bonds, for example, have historically shown a mild negative correlation, which is why the classic 60/40 portfolio became the default allocation for decades.
เคล็ดลับสำหรับมืออาชีพ: Use rolling 90-day or 180-day correlation windows instead of a single static figure. Markets shift, and a rolling window shows you how the relationship between two assets has evolved over time, not just where it stands today.

The Pearson formula has a critical limitation. It only captures linear correlation relationships, meaning it misses non-linear dependencies and tail behavior. Two assets can show a low Pearson correlation in normal markets yet crash together violently during a crisis. This gap between measured and actual dependence is where many portfolios fail.
How does asset correlation affect portfolio diversification?
The importance of asset correlation in portfolio construction cannot be overstated. Combining assets with low or negative correlation reduces overall portfolio volatility without requiring you to lower your expected return. This is the central insight of Modern Portfolio Theory, developed by Harry Markowitz in the 1950s and still the foundation of institutional asset allocation today.
Consider these common asset pairs and their typical correlation behavior:
| Asset Pair | Typical Correlation | Diversification Benefit |
|---|---|---|
| U.S. stocks and Treasury bonds | Mildly negative to near zero | High in normal markets |
| U.S. stocks and gold | Low positive to mildly negative | Moderate, especially in crises |
| U.S. stocks and emerging market stocks | Moderate positive (0.5–0.7) | จำกัด |
| Bitcoin and U.S. stocks | Variable, trending higher | Declining over time |
The practical takeaway is clear. Adding Treasury bonds to a stock portfolio historically smoothed returns because the two assets did not fall at the same time. Gold has served a similar role, particularly during inflationary periods or geopolitical shocks.
Correlation also drives risk budgeting strategies, where you allocate capital based on each asset’s contribution to total portfolio risk rather than its dollar weight. A 10% allocation to a highly correlated asset may contribute 30% of your portfolio’s total variance. Knowing the correlation matrix lets you see that before it costs you.
- Strategic asset allocation uses long-term average correlations to set target weights across asset classes.
- Tactical asset allocation adjusts those weights when correlation regimes shift, such as when stocks and bonds start moving together.
- ความเท่าเทียมกันของความเสี่ยง weights assets so each contributes equally to portfolio volatility, which requires constant correlation monitoring.
The goal in every case is the same. You want assets whose prices are driven by different fundamental forces, so that when one falls, the others do not necessarily follow.
How do correlations change during market crises?
This is where understanding asset correlation becomes genuinely critical, and where most retail investors get hurt. Pairwise equity correlations rise from roughly 0.30 in normal markets to 0.70–0.80 or higher during systemic crises. That shift destroys the diversification you thought you had.
During the 2008 financial crisis and the March 2020 COVID crash, correlations across nearly all risk assets spiked toward 1.0. Stocks, corporate bonds, commodities, and even some currencies fell together. The only assets that held their diversification properties were U.S. Treasury bonds and the U.S. dollar, and even those relationships have shown signs of strain in recent years.
The reason is tail dependence. In calm markets, assets may move independently most of the time. But in extreme stress, liquidity dries up and forced selling hits everything simultaneously. Diversification fails in crises precisely because investors treat it as a collection of assets rather than an architecture of dependence.
เคล็ดลับสำหรับมืออาชีพ: Do not rely on a single correlation figure calculated from calm-market data. Run your correlation analysis across multiple market regimes, including periods of high volatility like 2008 and 2020, to see how your portfolio would actually behave under stress.
Correlations calculated during calm periods give false security because they can cause investors to underestimate portfolio tail risk by 40–60%. That is not a rounding error. That is the difference between a portfolio that survives a crisis and one that forces you to sell at the worst possible moment.
Advanced practitioners use regime-switching models and Markov chain frameworks to account for the fact that correlation depends on market state. Professional risk managers also use tail-dependent copulas, which are mathematical models that specifically capture the probability of two assets crashing together, a risk that the Pearson coefficient completely ignores.
How to measure asset correlation: tools and practical steps
Measuring asset correlation does not require a Bloomberg terminal. Several accessible tools let you run this analysis yourself.
- Portfolio Visualizer (portfoliovisualizer.com): The most widely used free tool for retail investors. Enter two or more ticker symbols, select a time period, and it generates a full correlation matrix with rolling charts.
- Microsoft Excel or Google Sheets: Use the CORREL function with two columns of historical return data. Pull price history from Yahoo Finance or Google Finance, calculate periodic returns, then run CORREL on those return columns.
- MetaTrader 4: Ollatrade’s platform integrates MetaTrader 4, which supports custom indicators and scripts for calculating correlation between Forex pairs, metals, and indices directly on your charts.
- Python with pandas: For traders comfortable with code, the pandas library calculates a full correlation matrix with a single line. This approach scales to dozens of assets and allows rolling window analysis.
Once you have your correlation data, combine it with other metrics for a complete picture. Correlation alone does not tell you about individual asset volatility. A pair with a correlation of 0.3 but extreme individual volatility can still produce large portfolio swings. Pair your correlation matrix with standard deviation data and maximum drawdown figures to get a realistic view of portfolio risk exposure.
The most common mistake investors make is treating correlation as a fixed number. Correlation is fluid over time, shifting with monetary policy, geopolitical events, and economic regimes. The stock-bond correlation that was reliably negative for 20 years turned positive in 2022 when the Federal Reserve raised rates aggressively. Investors who assumed that relationship was permanent lost on both sides of their portfolio simultaneously.
A second common mistake is confusing correlation with causation. Two assets can be highly correlated without any direct relationship. Always ask what fundamental driver explains the co-movement before making an allocation decision based on correlation data alone.
ประเด็นสำคัญ
Asset correlation is the single most important relationship metric for building a portfolio that holds up across different market conditions, not just during calm periods.
| จุด | รายละเอียด |
|---|---|
| คำจำกัดความหลัก | Asset correlation measures co-movement between two assets on a scale from -1 to +1. |
| Crisis behavior | Correlations spike from 0.30 to 0.70–0.80 or higher during systemic crises, eroding diversification. |
| Pearson limitation | The Pearson coefficient misses tail dependence, so calm-market data underestimates crisis risk by 40–60%. |
| Correlation is not fixed | Monetary policy, geopolitical shifts, and regime changes all alter correlations over time. |
| Practical application | Use rolling windows, multiple market regimes, and tools like Portfolio Visualizer or MetaTrader 4 for realistic analysis. |
Why I think most investors use correlation wrong
Most investors treat correlation as a destination. They run the numbers once, build a portfolio, and assume the job is done. That is the wrong way to use this tool.
Correlation is a snapshot, not a contract. The stock-bond relationship that defined portfolio construction for two decades broke down in 2022 in a matter of months. Investors who had never questioned that assumption paid for it.
The deeper problem is that most retail investors diversify by asset name, not by fundamental driver. Owning ten different equity ETFs is not diversification if they all respond to the same interest rate and earnings cycle. Real diversification means owning assets whose prices are pulled by genuinely different forces: growth expectations, inflation, currency flows, commodity supply. Correlation statistics are the output of those drivers, not the drivers themselves.
I also think the obsession with finding negatively correlated assets misses the point. You do not need a perfect hedge. You need a portfolio where not everything falls at the same time and by the same amount. A correlation of 0.2 between two assets is enormously valuable, even if it is not -1. The goal is resilience, not perfection.
Monitor your correlation matrix at least quarterly. When you see relationships shifting, ask why before you act. The answer to that question will tell you more about your portfolio’s real risk than any single number can.
— เอฟเอ็กซ์
Put your correlation knowledge to work with Ollatrade

Understanding asset correlation is only useful if you can act on it. Ollatrade gives you access to Forex pairs, CFDs on metals, indices, stocks, energies, and cryptocurrencies, the full range of instruments you need to build a genuinely diversified portfolio across uncorrelated asset classes. The platform integrates MetaTrader 4, which supports correlation analysis directly on your charts. Whether you are mapping relationships between currency pairs or comparing gold against equity indices, the tools are built in. Start with Ollatrade’s แพลตฟอร์มการซื้อขายฟอเร็กซ์ to explore how different instruments move relative to each other, and use the trading risk management guide to apply correlation insights to your live positions.
คำถามที่พบบ่อย
What is the definition of asset correlation?
Asset correlation is a statistical measure of how two financial instruments move in relation to each other, expressed as a coefficient between -1 and +1. A value of +1 means perfect co-movement, -1 means perfect inverse movement, and 0 means no relationship.
Why does asset correlation matter for diversification?
Low or negative correlation between assets reduces overall portfolio volatility without lowering expected returns. Combining assets that do not move together is the core mechanism behind Modern Portfolio Theory and effective risk management.
How do correlations behave during a financial crisis?
Pairwise equity correlations rise from roughly 0.30 in normal markets to 0.70–0.80 or higher during systemic crises, sometimes approaching 0.95. This spike erodes diversification precisely when investors need it most.
What affects asset correlation over time?
Correlation shifts with monetary policy changes, geopolitical events, and economic regime transitions. The stock-bond correlation, for example, turned from negative to positive in 2022 as the Federal Reserve raised interest rates aggressively.
What is the best tool to measure asset correlation?
Portfolio Visualizer is the most accessible free tool for retail investors, offering full correlation matrices and rolling charts. Traders on MetaTrader 4 can use custom indicators to calculate correlation between Forex pairs and other instruments directly on the platform.