باختصار شديد:
- غالباً ما تتبخر السيولة أثناء اضطرابات السوق، مما يزيد من تكاليف التداول ومخاطر فشل عمليات التنفيذ.
- يجمع القياس الفعال بين المقاييس القائمة على التداول والمقاييس القائمة على دفتر الطلبات بما يتماشى مع أسلوب التداول الخاص بك.
- يعد تكييف الاستراتيجيات - تقليل الحجم، واستخدام أوامر الحد، ومراقبة البيانات في الوقت الفعلي - أمرًا ضروريًا خلال الظروف غير السائلة.
يفترض معظم المتداولين أن السيولة متوفرة وجاهزة بمجرد النقر على زر "شراء" أو "بيع". هذا الافتراض من أغلى الأخطاء التي يمكن ارتكابها. تُظهر الأبحاث أن تتبخر السيولة عند الحاجة تزداد حدة هذه الظاهرة خلال فترات اضطراب السوق، مدفوعةً بالغموض المحيط بمراكز الأطراف المقابلة وتدفق الأوامر، مما قد يُؤدي إلى هشاشة في التوازن. بعبارة أخرى، في اللحظة التي تكون فيها في أمسّ الحاجة إلى الخروج من مركزك بسلاسة، قد ينقلب السوق ضدك بطرق لم تُنذرك بها أي من مؤشرات السوق. تُحلل هذه المقالة ماهية سيولة السوق، وكيفية قياسها بدقة، وأسباب انهيارها تحت الضغط، وكيفية تكييف استراتيجيات التداول الخاصة بك للبقاء متقدمًا على تقلبات السيولة.
جدول المحتويات
- ما هي سيولة السوق ولماذا هي مهمة؟
- كيفية قياس السيولة: الأدوات والمقاييس التي يستخدمها المتداولون
- السيولة تحت الضغط: عندما تصبح الأسواق الجيدة غير سائلة
- تكييف استراتيجيات التداول مع ظروف السيولة
- لماذا يسيء معظم المتداولين فهم السيولة - وما يهم حقاً؟
- ارتقِ بتداولك إلى مستوى أعلى باستخدام الأدوات الاحترافية
- الأسئلة الشائعة
أهم النقاط
| نقطة | تفاصيل |
|---|---|
| السيولة ديناميكية | يمكن أن تتغير سيولة السوق بسرعة، خاصة خلال الأحداث المتقلبة أو المجهدة. |
| استخدم تدابير متعددة | يجمع تحليل السيولة الفعال بين مقاييس مختلفة، وليس فقط حجم التداول أو فرق السعر. |
| خطر صدمات السيولة | يمكن أن تؤدي ظروف السوق غير الشفافة إلى تبخر مفاجئ للسيولة، مما يؤثر على التنفيذ. |
| مواءمة الاستراتيجيات مع الظروف | يُعد تكييف الاستراتيجيات مع السيولة الحالية أمراً بالغ الأهمية لتقليل المخاطر والانزلاق السعري. |
ما هي سيولة السوق ولماذا هي مهمة؟
تُشير سيولة السوق إلى مدى سرعة وسهولة شراء أو بيع أصل ما دون التأثير بشكل كبير على سعره. فالسوق ذو السيولة العالية يُتيح لك تنفيذ أوامر كبيرة بسعر مُحدد أو قريب منه. أما السوق ذو السيولة المنخفضة فيُجبرك على قبول سعر أقل، أو الانتظار لفترة أطول لتنفيذ الأمر، أو تقسيم طلبك إلى أجزاء أصغر لإتمام الصفقة.
بالنسبة للمتداولين الأفراد والمحترفين على حد سواء، تؤثر السيولة على كل صفقة. إليك ما يكلفك انخفاض السيولة عمليًا:
- انتشار أوسع. عندما يقل عدد المشاركين النشطين، تتسع الفجوة بين سعر العرض وسعر الطلب. وهذا بدوره يزيد فوراً من تكلفة الدخول والخروج. فهم ذلك أمر بالغ الأهمية. انتشار التداول يُعد هذا الأمر ضرورياً لأنه حتى التغيير الطفيف ظاهرياً في فرق السعر يمكن أن يؤدي إلى تآكل جزء كبير من أرباحك المتوقعة في الصفقات قصيرة الأجل.
- الانزلاق. يتم تنفيذ طلبك بسعر أسوأ من السعر المحدد لأن عدد الطلبات على المستوى الذي استهدفته غير كافٍ.
- عمليات تعبئة فاشلة أو جزئية. في حالات انعدام السيولة الشديدة، لا يتم تنفيذ الطلبات بالكامل، مما يجعلك عرضة للخطر.
- عدم استقرار الأسعار. يؤدي انخفاض السيولة إلى تضخيم تقلبات الأسعار، مما يعني أن أمر وقف الخسارة قد يتم تفعيله عند سعر أسوأ بكثير من السعر المقصود.
إن السيولة ليست خاصية ثابتة للسوق. فهي تتغير باستمرار بناءً على وقت اليوم، وسلوك المشاركين في السوق، والأحداث الخارجية. حجم التداول يُعدّ مؤشر السيولة أحد المؤشرات التقريبية، ولكنه لا يُقدّم الصورة كاملة. فالسوق الذي يتميّز بحجم تداول كبير ولكنه مُركّز بين عدد قليل من المشاركين الكبار، قد يظلّ غير سائل عملياً بالنسبة للمتداول الفردي الذي يحاول تحريك مركز ذي قيمة.
“"عادةً ما تتلاشى السيولة عندما تشتد الحاجة إليها أثناء الأزمات، مدفوعةً بالغموض المحيط بمراكز الأطراف المقابلة وتدفق الطلبات. ويمكن أن يؤدي هذا الغموض إلى هشاشة الوضع كخاصية توازن." المصدر
تُجسّد هذه المقولة أمراً بالغ الأهمية: مخاطر السيولة ليست مجرد ضجيج عشوائي، بل لها بنية محددة. فالظروف التي تدفعك إلى التداول بسرعة هي غالباً الظروف التي تجعل التداول صعباً للغاية.
كيفية قياس السيولة: الأدوات والمقاييس التي يستخدمها المتداولون
من أكثر المفاهيم الخاطئة شيوعاً في التداول الاعتقاد بأن السيولة لها رقم واحد واضح يمكن التحقق منه. هذا غير صحيح. فالمقاييس المختلفة تعكس أبعاداً مختلفة للسيولة، ويعتمد اختيار المقياس المناسب كلياً على أسلوب التداول والهدف المرجو.
المقاييس القائمة على التداول مقابل المقاييس القائمة على سجل الطلبات يمثل هذان النهجان طريقتين مختلفتين للنظر إلى المشكلة نفسها. تركز المقاييس القائمة على التداول على ما حدث بالفعل: الحجم، وقيمة التداول، وتواتر المعاملات. بينما تركز المقاييس القائمة على دفتر الأوامر على ما هو متاح حاليًا: الفارق السعري الظاهر، وعمق السوق عند كل مستوى سعري، وعدم التوازن بين أوامر الشراء والبيع. تشير أبحاث السيولة إلى, قد يُقدّم هذان النهجان روايتين مختلفتين تمامًا عن السوق نفسه في اللحظة نفسها. إنّ مواءمة المؤشر المناسب مع آلية التداول الفعلية هو ما يُميّز التنفيذ المُنضبط عن التخمين.
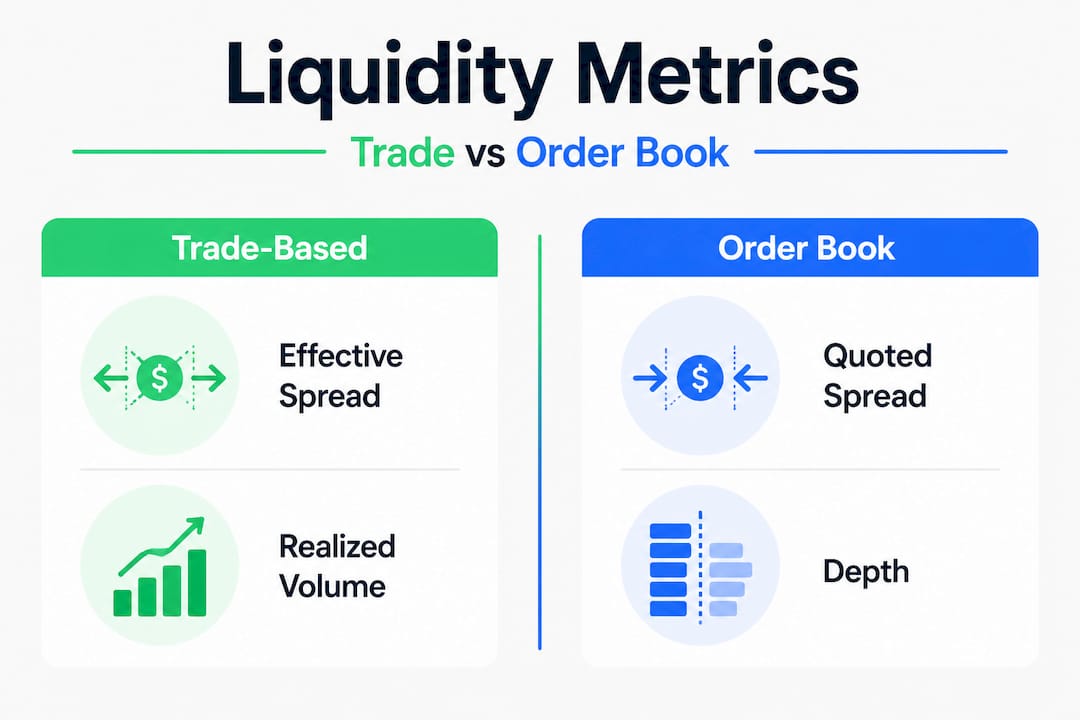
فيما يلي مقارنة بين أكثر مقاييس السيولة استخداماً:
| متري | يكتب | ما يقيسه | يُفضل استخدامه لـ |
|---|---|---|---|
| انتشار الأسعار | دفتر الطلبات | فجوة واضحة بين سعر العرض والطلب | تقدير سريع للتكلفة |
| انتشار فعال | التجارة القائمة على التجارة | تكلفة المعاملة الفعلية | تحليل ما بعد التداول |
| انتشار محقق | التجارة القائمة على التجارة | إيرادات صانع السوق | رؤى حول الاختيار العكسي |
| تأثير السعر | التجارة القائمة على التجارة | تكلفة تحريك السوق | تنفيذ الطلبات الكبيرة |
| عمق السوق | دفتر الطلبات | تتوفر كميات كبيرة بأسعار مناسبة | قرارات تقسيم الطلبات |
تتمثل المنهجية العملية للمتداولين الجادين في: تعامل مع السيولة كمتغير حالة وحساب المقاييس ذات الصلة بالتنفيذ، مثل فرق السعر الفعلي، وفرق السعر المحقق، وتأثير السعر، بدلاً من الاعتماد فقط على فرق السعر الظاهر في أعلى دفتر الأوامر. يفصل هذا النهج التكلفة المباشرة للصفقة عن تكلفة الاختيار السلبي، وهي ما يعرفه السوق ولا تعرفه أنت.
إليك كيفية إنشاء روتين أساسي لمراقبة السيولة:
- تحقق من الفارق المذكور عند وقت دخولك المخطط له، وليس فقط عند تحليل الصفقة لأول مرة. قد تتغير فروق الأسعار بشكل كبير بين تحليلك وتنفيذك الفعلي.
- استعرض أحدث عمليات التوزيع الفعالة باستخدام بيانات التداول الخاصة بالوسيط أو أداة تحليل خارجية لمعرفة مقدار الانزلاق الذي حدث بالفعل في ظروف مماثلة.
- افحص عمق دفتر الطلبات عند المستويات المحيطة بنقاط الدخول والخروج المستهدفة لتقدير مقدار تحرك السعر إذا قمت بوضع طلب أكبر.
- رصد تقديرات تأثير الأسعار إذا كنت تتداول بكميات كبيرة، فحتى المراكز الصغيرة في الأدوات المالية الأقل سيولة يمكن أن تؤثر على الأسعار بشكل كافٍ للإضرار بجودة تنفيذ صفقاتك.
- تحقق من أنماط الحجم لفهم ما إذا كانت قراءة السيولة الحالية نموذجية لهذا الوقت من اليوم وجلسة السوق.
نصيحة احترافية: لا تكتفِ بمراقبة رسوم التداول بمعزل عن غيرها. اجمع بيانات الرسوم مع قياسات فروق الأسعار الفعّالة للحصول على التكلفة الإجمالية الحقيقية لكل صفقة. قد تكلفك عمولة منخفضة مصحوبة بانزلاق سعري كبير أكثر بكثير من عمولة أعلى قليلاً مع تنفيذ دقيق ومتسق.
استخدام أدوات رسم بياني متقدمة إن عرض ملفات تعريف الحجم وبيانات تدفق الطلبات يمنحك ميزة في الوقت الفعلي في تقييم ظروف السيولة قبل الالتزام بمركز معين.
السيولة تحت الضغط: عندما تصبح الأسواق الجيدة غير سائلة
حتى الأسواق المعروفة بسيولة عالية قد تشهد انخفاضًا مفاجئًا في السيولة بسرعة كبيرة. ففي الانهيار المفاجئ الذي حدث في 6 مايو 2010، انخفض مؤشر داو جونز الصناعي بنحو 1000 نقطة في دقائق قبل أن يتعافى بالسرعة نفسها تقريبًا. وقد شهدت أسواق الفوركس أحداثًا مماثلة عقب إعلانات البنوك المركزية، بما في ذلك إلغاء البنك الوطني السويسري المفاجئ للحد الأدنى لسعر صرف اليورو مقابل الفرنك السويسري في يناير 2015، مما أدى إلى ارتفاع حاد في فروق الأسعار وتنفيذ العديد من الطلبات بأسعار أسوأ بكثير من الأسعار المعلنة.

ما الذي يدفع هذه الانهيارات المفاجئة؟ الآلية سلوكية أكثر منها ميكانيكية. عندما يرتفع مستوى عدم اليقين، يسحب المشاركون في السوق، الذين عادةً ما يوفرون السيولة عبر وضع أوامر محددة السعر، أوامرهم. فهم لا يريدون أن يكونوا في الجانب الخاسر من تحرك سريع. ومع انسحاب كل مشارك، يزداد عدم اليقين لدى الآخرين بشأن ما يعرفه المشاركون المتبقون، مما يؤدي إلى مزيد من الانسحاب. تبدو السيولة جيدة ظاهريًا، لكنها تنهار لأن الغموض والسلوك الاستراتيجي يدفعان الأطراف المقابلة إلى تشديد شروط التسعير تحديدًا عندما يكون المتداولون في أمس الحاجة إلى التنفيذ.
إليكم كيف تبدو هذه العملية في جدول بيانات يوضح ظروف السيولة النموذجية خلال بيئات السوق العادية مقابل بيئات السوق المضطربة:
| حالة | انتشار الأسعار | عمق السوق | معدل تنفيذ الطلبات | خطر الانزلاق |
|---|---|---|---|---|
| ساعات التداول العادية | ضيق | عميق | عالي | قليل |
| بيان صحفي تمهيدي | توسيع | رقيق | معتدل | مرتفع |
| أثناء إصدار البيانات | واسع جداً | رقيق جداً | قليل | مرتفع جداً |
| تثبيت ما بعد الصدمة | شد تدريجي | إعادة البناء | تحسين | معتدل |
“"تركز النماذج على الغموض وتأثيرات السلوك الاستراتيجي التي تدفع الأطراف المقابلة إلى سحب عروض الأسعار أو تشديدها تحديداً عندما يكون المتداولون في أمس الحاجة إلى تنفيذ الصفقات." المصدر
ما الذي يجب مراقبته لتوقع ضغوط السيولة؟ هناك عدة مؤشرات مفيدة باستمرار. راقب أخبار السوق وأحداث المخاطر على التقويم الاقتصادي، تعامل مع الإصدارات الرئيسية المجدولة على أنها فترات مخاطر سيولة مرتفعة. راقب اتساع فرق سعر العرض والطلب في الدقائق التي تسبق الأحداث الرئيسية. انتبه إلى انخفاض حجم دفتر الأوامر بشكل غير معتاد، حيث ينخفض عمق التداول عند مستويات الأسعار الرئيسية حتى في حين يبدو السعر مستقرًا.
نصيحة احترافية: إذا لاحظت اتساعًا مفاجئًا في فروق الأسعار مصحوبًا بانخفاض في حجم الطلبات قبل أي أخبار واضحة، فاعتبر ذلك إشارة تحذيرية. غالبًا ما يسحب المتداولون ذوو الخبرة سيولتهم قبل أن تصبح الصدمة علنية. يمكن أن يكون هذا النمط بمثابة إنذار مبكر لك.
فهم التكاليف الخفية في فروق أسعار الوساطة كما أنه ضروري خلال فترات التوتر، حيث يقوم العديد من الوسطاء بتوسيع فروق الأسعار بشكل كبير عندما يتراجع مزودو السيولة، ويمكن أن تتراكم هذه التكاليف بسرعة إذا كنت تحاول الخروج من المراكز خلال سوق سريع الحركة.
تكييف استراتيجيات التداول مع ظروف السيولة
لا يُجدي فهم مخاطر السيولة نفعاً إلا إذا غيّرت أسلوب تداولك بناءً عليها. ويكمن الفرق بين المتداولين الذين ينجون من تقلبات السيولة والذين يتكبدون خسائر فادحة عادةً في الاستعداد والمرونة التكتيكية.
لماذا تحتاج الاستراتيجيات إلى التكيف؟ قد يختلف أداء الاستراتيجية الناجحة في ظروف السوق العادية اختلافًا جذريًا عند انخفاض السيولة. يصبح النهج القائم على الزخم، والذي يعتمد على التنفيذ السريع للاستفادة من تحركات الأسعار القصيرة، أكثر خطورةً عندما تتسع فروق الأسعار الفعّالة ويؤدي الانزلاق السعري إلى تآكل ميزتك التنافسية. لذا، يتطلب تعديل استراتيجيتك معرفة نظام السوق الذي تعمل فيه قبل استثمار رأس المال.
فيما يلي التعديلات التكتيكية الأساسية التي يستخدمها المتداولون ذوو الخبرة:
- قلل حجم المراكز قبل حدوث حالات انعدام السيولة المعروفة. تؤدي إعلانات الأرباح وقرارات البنوك المركزية والتطورات الجيوسياسية إلى تقليص فترات السيولة. ويعني الحجم الأصغر انزلاقاً أقل ومخاطر أقل.
- استخدم أوامر الحد بدلاً من أوامر السوق خلال فترات انخفاض السيولة. تضمن أوامر السوق التنفيذ، لكنها لا تضمن السعر. أما أوامر الحد فتضمن السعر، لكنها لا تضمن التنفيذ، وفي كثير من الحالات يكون تفويت الصفقة أفضل من تنفيذها بشكل سيئ.
- قسّم الطلبات الكبيرة إلى أجزاء أصغر. يؤدي تقسيم الطلب الكبير على فترات زمنية إلى تقليل تأثير السعر عليك ويمنعك من تحريك السوق ضدك عن طريق الخطأ.
- مراقبة مؤشرات السيولة المحققة خلال اليوم. تؤكد الأبحاث أن تكاليف تنفيذ الأسهم الأمريكية تحسّنت الأوضاع على المدى الطويل، لكن هشاشة السيولة على المدى القصير لا تزال قائمة. لذا، يُعدّ اختبار استراتيجياتك في ظلّ تغيّرات السوق خلال اليوم باستخدام مقاييس السيولة الفعلية ممارسةً أساسية، وليست تحسينًا اختياريًا.
فيما يلي إطار عمل تنفيذي مرقم للتداول في ظروف سيولة متفاوتة:
- تقييم نظام السيولة قبل بدء الجلسة، استخدم منصة الرسوم البيانية الخاصة بك للتحقق من أنماط الانتشار التاريخية لهذا الوقت من اليوم، وتحقق من التقويم الاقتصادي للأحداث المقررة.
- تحديد عتبات السيولة بالنسبة لاستراتيجيتك، حدد الحد الأقصى للفرق السعري أو الحد الأدنى للعمق الذي ترغب في تنفيذ كل نوع من أنواع الصفقات عنده.
- قم بتطبيق أنواع الطلبات المناسبة بناءً على تقييم السيولة الحالي. يتم اللجوء إلى أوامر الحد عند ارتفاع فروق الأسعار.
- مراقبة جودة التنفيذ في الوقت الفعلي باستخدام بيانات فروق الأسعار الفعّالة ومعدلات التنفيذ. إذا كانت عمليات التنفيذ أسوأ باستمرار من المتوقع، فقد يكون نظام السيولة قد تغير.
- مراجعة ما بعد التداول. احسب الفرق المحقق وتأثير السعر بعد كل جلسة لتكوين صورة دقيقة لتكاليف التنفيذ الفعلية بمرور الوقت.
نصيحة احترافية: أنشئ قائمة مراجعة قبل التداول تجبرك على التأكد من ظروف السيولة الحالية قبل كل صفقة مهمة. يستغرق الأمر 60 ثانية فقط، ويمكن أن يمنع عمليات التنفيذ المكلفة خلال فترات انخفاض السيولة غير المتوقعة في الأسواق. ادمج ذلك مع استراتيجية تداول منظمة جيدًا. سير عمل التداول للحفاظ على الاتساق في مختلف بيئات السوق.
لماذا يسيء معظم المتداولين فهم السيولة - وما يهم حقاً؟
إليكم الحقيقة المزعجة: معظم مؤشرات السيولة القياسية هي ملخصات إحصائية لظروف سابقة، وليست ضمانات فورية لإمكانية التداول في المستقبل. عندما ترون فرق سعر ضيق على شاشتكم، فإنكم ترون أفضل سعر معروض في تلك اللحظة لحجم تداول صغير محدد. في اللحظة التي تحاولون فيها تداول حجم كبير أو في اللحظة التي يقع فيها حدث غير متوقع، يصبح هذا الرقم غير ذي صلة.
يُعدّ حجم التداول من أكثر المؤشرات التي يُساء فهمها. فارتفاع حجم التداول يُشير إلى كثرة عمليات التداول، ولكنه لا يُقدّم أي معلومات تُذكر حول مدى كفاية السيولة المتاحة عند السعر المطلوب لحجم التداول المُحدد. قد يشهد السوق حجم تداول هائلاً خلال تحركات سريعة نتيجةً لانهيار السيولة، مما يُجبر المتداولين المذعورين على التداول بأسعار مُتدنية للخروج من السوق. وكما تُؤكد أبحاث قياس السيولة، فإنّ المقاييس القائمة على حجم التداول والمقاييس القائمة على سجل الأوامر قد تُقدّم رؤى مُختلفة تماماً، ويجب أن يتماشى اختيار المقياس الأنسب مع الآلية المُحددة التي تُهمّك: سرعة التنفيذ، أو كفاية السيولة المتاحة، أو إمكانية تجاوز الانزلاق السعري.
لا يكتفي المتداولون الذين يديرون مخاطر السيولة بكفاءة بمراقبة الأرقام فحسب، بل يراقبون المؤشرات السلوكية. فهم يلاحظون اتساع فروق الأسعار قبل ظهور أي محفز واضح، ويتتبعون سرعة تنفيذ أوامرهم المحددة، سواء كانت أسرع أو أبطأ من المعتاد. كما يلاحظون متى تختلف أنماط حجم التداول عن حركة السعر، وهو ما يشير غالبًا إلى إعادة تموضع المؤسسات المالية، الأمر الذي يُغير بيئة السيولة قبل أن يلاحظه المتداولون الأفراد.
يكمن التحول الأساسي في طريقة التفكير في التعامل مع السيولة كمتغير يتم إدارته بفعالية بدلاً من اعتبارها حالة تلقائية مفترضة. غالباً ما يكتشف المتداولون الذين يتجاهلون هذا التمييز خطأهم في أسوأ وقت ممكن.
ارتقِ بتداولك إلى مستوى أعلى باستخدام الأدوات الاحترافية
إن تطبيق مبادئ السيولة هذه في الأسواق الحقيقية يتطلب أكثر من مجرد المعرفة - فهو يتطلب منصة مصممة للتنفيذ الدقيق والوصول إلى البيانات في الوقت الفعلي عبر مجموعة كاملة من الأدوات.
يمنحك تطبيق Olla Trade إمكانية الوصول إلى منصة تداول العملات الأجنبية بفضل فروق الأسعار الضيقة، وسرعات التنفيذ العالية، والتكامل مع منصة MetaTrader 4، يمكنك تطبيق استراتيجيات تراعي السيولة باستخدام أدوات احترافية. سواء كنت تتداول أزواج العملات أو المؤشرات أو المعادن، فإن فهم ما هي ديناميكيات الموائع الحسابية (CFDs) وكيف تعمل تساعدك أدواتنا المتقدمة في رسم المخططات على تنظيم مراكز تداول فعّالة في مختلف بيئات السيولة. كما توفر لك رؤية شاملة لتدفق الطلبات وبيانات عمق السوق اللازمة لمراقبة ظروف السيولة في الوقت الفعلي والتنفيذ بثقة.
الأسئلة الشائعة
ما هو الخطر الرئيسي لانخفاض سيولة السوق؟
يمكن أن يؤدي انخفاض سيولة السوق إلى زيادة الانزلاق السعري، واتساع فروق الأسعار، وحتى فشل تنفيذ الأوامر، وتميل هذه المشاكل إلى التفاقم خلال فترات التقلب عندما تتبخر السيولة تحت ضغط ناتج عن غموض الطرف المقابل.
كيف يمكن للمتداولين قياس سيولة السوق بفعالية؟
استخدم المقاييس القائمة على التداول والمقاييس القائمة على سجل الطلبات معًا. فالمقاييس المتعلقة بالتنفيذ، مثل فرق السعر الفعلي، وفرق السعر المحقق، وتأثير السعر، تمنحك صورة أدق بكثير من فرق السعر المعلن وحده.
لماذا تختفي السيولة أحيانًا أثناء الصدمات السوقية؟
يسحب الأطراف المقابلة عروض أسعارهم أو يشددونها لعدم يقينهم بما يعرفه المشاركون الآخرون. ويؤدي هذا السلوك الناجم عن التعتيم إلى اختفاء السيولة تحديداً عندما يكون المتداولون في أمس الحاجة إليها.
كيف تتغير تكاليف التنفيذ بتغير السيولة؟
بشكل عام، تؤدي الأسواق الأكثر سيولة إلى انخفاض تكاليف التنفيذ، ولكن هشاشة السيولة على المدى القصير لا تزال قائمة حتى في الأسواق التي كانت تتسم بالكفاءة تاريخياً، لذا فإن اختبار استراتيجياتك تحت الضغط في حالة التحولات المفاجئة في النظام يظل أمراً ضرورياً.
هل يُعد حجم التداول مؤشراً موثوقاً للسيولة؟
لا يكفي حجم التداول وحده. فالمقاييس القائمة على التداولات وتلك القائمة على سجل الأوامر قد تُظهر صوراً مختلفة تماماً، لذا ينبغي عليك اختيار مؤشر السيولة الذي يتناسب مع آلية التداول الخاصة بك ومراقبة إشارات متعددة معاً.