TL;DR:
- Most retail traders lose money mainly because they lack reliable methods for timing entries and exits, not because they choose the wrong markets. Technical analysis offers a structured approach to reading markets, emphasizing price, volume, and confluence of signals to improve trade probability. Proper risk management, simplicity, and emotional discipline are essential elements for consistent success in trading.
Most retail traders lose money not because they pick the wrong markets, but because they have no reliable method for timing entries and exits. You’re looking at a chart, feeling the pull of the price moving higher, and you enter. Then it reverses. Sound familiar? This guide to technical analysis gives you a structured way to read markets with confidence. You’ll learn the foundational principles, the most useful tools, and a step-by-step framework for spotting high-probability setups, all without needing a finance degree or years of trial and error.
Table of Contents
- Key takeaways
- The core principles of technical analysis
- Charts and indicators every trader should know
- How to apply technical analysis step by step
- Risk management built into your analysis
- Common mistakes that hold traders back
- My honest take on using technical analysis
- Start putting technical analysis to work with Ollatrade
- FAQ
Key takeaways
| Point | Details |
|---|---|
| Price tells the full story | Technical analysis uses price and volume data to find trade opportunities, not earnings reports or news. |
| Charts are psychological maps | Price patterns repeat because human emotions like fear and greed play out the same way over time. |
| Confluence raises your odds | Combining multiple signals, such as a trend, a pattern, and a momentum indicator, produces more reliable setups. |
| Risk management is non-negotiable | Even the best setups fail. Limiting risk to 1-2% per trade keeps you in the game long enough to win. |
| Rules beat feelings | Converting chart observations into explicit entry, stop-loss, and target rules removes emotion from execution. |
The core principles of technical analysis
Before you can apply any tool effectively, you need to understand why technical analysis works at all. Technical analysis uses price and volume data to identify trade opportunities, focusing entirely on what the market is doing rather than why it should be doing something else based on company earnings or economic reports.
Three core beliefs sit underneath every chart-based method:
- The market discounts everything. Every known piece of information, from a central bank decision to a company’s quarterly results, is already reflected in the current price. You don’t need to know the news; you need to read what the price is telling you.
- Price moves in trends. Markets don’t move randomly. They push in one direction, consolidate, and then continue or reverse. Technical analysis has operated on this principle for over 300 years, and it remains the foundation of chart reading today.
- History repeats itself. Market price patterns reflect the collective psychology of buyers and sellers. Fear and greed produce the same patterns repeatedly, which is exactly why patterns like head-and-shoulders or double bottoms hold predictive value.
The contrast with fundamental analysis is worth stating directly. Fundamental analysis asks what a market should be worth. Technical analysis asks what traders are actually doing with it right now. Both approaches have their place, but for short-to-medium-term trading decisions, price action gives you the most immediate read on market sentiment.
Charts and indicators every trader should know
Understanding technical indicators starts with choosing the right chart type. You have three main options: line charts (which connect closing prices), bar charts (which show the open, high, low, and close for each period), and candlestick charts. For most traders, candlesticks are the most popular format because each candle visually represents the battle between buyers and sellers within a single period.
Here’s a quick comparison of the three chart types:
| Chart type | What it shows | Best used for |
|---|---|---|
| Line chart | Closing prices only | Spotting long-term trend direction |
| Bar chart | Open, high, low, close | Detailed price range analysis |
| Candlestick chart | Open, high, low, close with color coding | Reading momentum and reversals |
Once you’re reading candlesticks comfortably, you layer in technical indicators. The three most widely used are moving averages, the Relative Strength Index (RSI), and the Moving Average Convergence Divergence (MACD). Moving averages and momentum oscillators like RSI and MACD are the standard toolkit for identifying trend direction and momentum strength.
Moving averages smooth out price noise and tell you the general direction of the market. The RSI measures whether a market is overbought or oversold on a scale of 0 to 100. The MACD tracks the relationship between two moving averages and generates buy or sell signals when they cross. Each indicator answers a different question, which is why using them together gives you a fuller picture than relying on any one alone.

Pro Tip: Never use an indicator to tell you what you want to hear. If you’re bullish on a chart, actively look for bearish signals from your indicators. The goal is objective confirmation, not validation.
How to apply technical analysis step by step
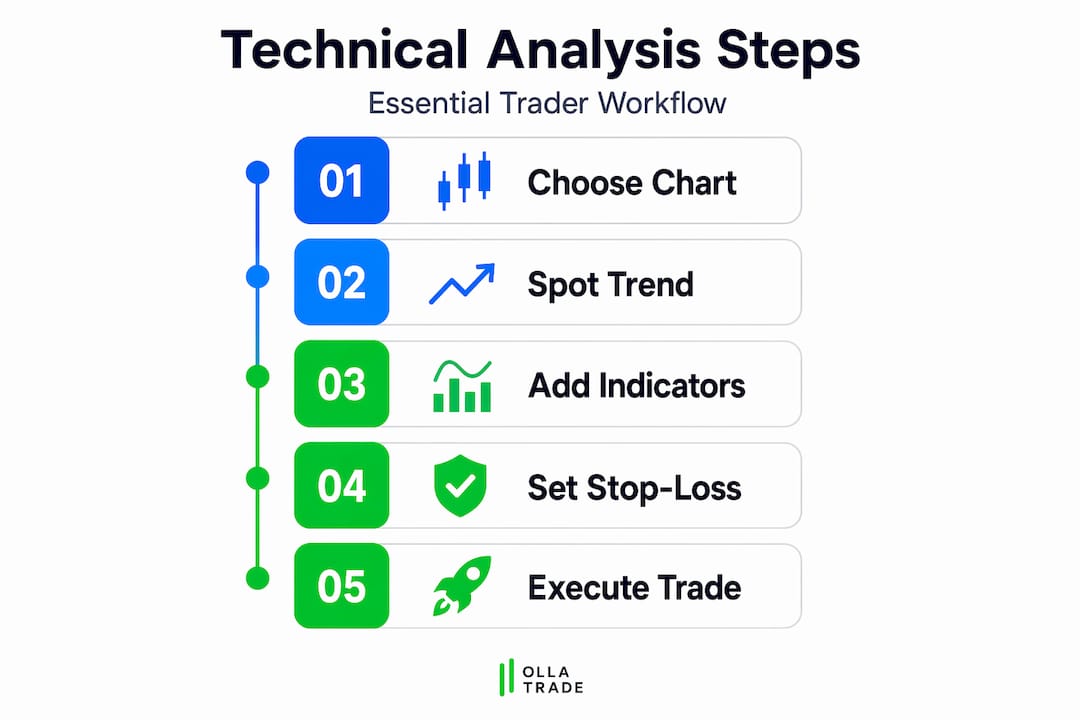
A structured approach to chart analysis techniques separates traders who improve over time from those who chase random signals. Follow this sequence every time you analyze a chart.
-
Identify the dominant trend. Start on a higher time frame, such as the daily or weekly chart. Apply a 50-period and 200-period moving average. If price is above both and the 50 is above the 200, the trend is up. Trade in that direction until the evidence changes.
-
Map your support and resistance levels. These are the price zones where buying or selling has historically been strong. Draw horizontal lines at obvious price peaks and troughs. These levels become your reference points for everything else.
-
Look for a chart pattern or signal. Common patterns like flags, triangles, or double bottoms form at or near support and resistance. A pattern forming at a key level carries more weight than one forming in the middle of a range.
-
Confirm with multiple indicators. This is the step most beginners skip. Combining multiple technical signals such as a bullish pattern, an RSI reading above 50, and a MACD crossover dramatically improves the probability of a trade working out. This concept is called confluence, and it’s one of the most reliable best practices for technical analysis.
-
Set your entry and exit points before you trade. Decide exactly where you will enter, where your stop-loss goes, and where you will take profit. Write it down. Converting chart patterns into explicit rules with stop-loss and position size is the defining difference between a professional setup and a guess.
Pro Tip: If you can’t explain your trade setup in two sentences without referencing a feeling or a hunch, it’s not ready to trade. Clarity of reasoning is a direct proxy for quality of setup.
Risk management built into your analysis
Technical analysis tutorial content often stops at spotting patterns. The part that actually determines whether you survive as a trader is what happens after you take the trade. Risk management isn’t separate from technical analysis. It’s built directly into how you use it.
Here’s what a sound risk management process looks like alongside your chart work:
- Place your stop-loss at a logical price level, not an arbitrary dollar amount. If you’re buying above a support level, your stop goes just below that support. The chart tells you where you’re wrong, not your account balance.
- Limit your risk per trade to 1-2% of your total capital. This is not a conservative suggestion. Risk management using the 1-2% rule allows you to absorb a string of losing trades without a catastrophic drawdown.
- Set your profit target at a realistic level based on the nearest resistance. If your stop is 30 pips below entry, don’t set a 90-pip target if strong resistance sits 40 pips away. Respect the chart.
- Accept that even the best setups fail around 30-40% of the time. This is the probabilistic reality of trading. Your edge comes from letting winners run and cutting losers short, not from being right every time.
- Build a risk management strategy before you ever open a position. The plan matters most when your emotions are pulling hardest.
Common mistakes that hold traders back
Even a solid understanding of chart patterns won’t save you if you fall into the behavioral traps that derail most retail traders. Here’s what to watch for as you develop your skills:
- Over-relying on a single indicator. No indicator is right all the time. An RSI showing oversold conditions during a strong downtrend doesn’t mean the market will reverse. Context matters more than any single reading.
- Confirmation bias in chart reading. You decide the market is going up, then find signals that agree. This is one of the most expensive mental mistakes in trading. Force yourself to build the bearish case before taking a bullish trade.
- Ignoring broader market context. A textbook breakout pattern on a minor currency pair carries very different weight during a high-volatility news week than during a quiet session. Fundamentals don’t have to drive your trades, but they should inform your timing.
- Skipping backtesting. Before trading any setup live, test it against historical data. Backtesting turns a chart pattern theory into measurable evidence. It also reveals how often the setup fails and under what conditions.
- Not keeping a trade journal. The fastest way to improve is to document every trade. Record your reasoning, your entry, your exit, and what actually happened. Patterns in your own mistakes are more valuable than any technical analysis tutorial you’ll ever read.
A good resource for deepening your formal education is the course library at Verdant, which covers structured approaches to trading and market analysis for serious learners.
My honest take on using technical analysis
I’ve been watching traders approach charts for a long time, and the one thing that separates those who improve from those who stay stuck is this: they stop treating technical analysis as a prediction machine and start treating it as a probability framework.
Charts don’t tell you what will happen. They tell you what is more likely to happen given how similar situations have resolved in the past. Technical analysis focuses on probabilistic outcomes, and once you genuinely accept that, your whole relationship with losing trades changes. A stop-loss hit isn’t a failure. It’s the system working.
What I’ve found actually works in practice is keeping it simple. Most profitable traders I know use two or three indicators consistently rather than rotating through a dozen based on what feels right that week. They know their setups cold, they know their risk rules cold, and they execute without hesitation. The complexity comes from the market. Your job is to bring simplicity and structure to the chaos.
If you’re just starting out, pick one chart type, learn two indicators deeply, and trade one market. Build your technical forex analysis skills on a consistent foundation before branching out. Most beginners do the opposite and wonder why nothing sticks. Narrowing your focus is not a limitation. It’s how mastery is built.
— FX
Start putting technical analysis to work with Ollatrade
If you’re ready to move from reading charts to trading them, Ollatrade gives you the tools to do exactly that.

Ollatrade’s platform integrates advanced charting tools with MetaTrader 4, giving you full access to the indicators, time frames, and order types covered in this guide. You can apply technical analysis across forex pairs, CFD indices, metals, energies, and cryptocurrencies, all from a single account. New to forex? The forex trading step by step guide walks you through account setup, trade execution, and risk management in a format built specifically for retail traders. Ollatrade also offers competitive spreads and fast execution so that your technical setups don’t get undermined by slippage or delay. Explore the full forex trading platform and see how your chart reading translates into real trades.
FAQ
What is technical analysis in trading?
Technical analysis is the practice of using historical price and volume data to forecast future market movements and identify trade entry and exit points. It focuses on what the market is doing rather than why, using charts, patterns, and indicators as its primary tools.
Why use technical analysis over fundamental analysis?
Technical analysis gives traders a direct read on market sentiment and timing, which fundamental analysis alone cannot provide. For short-to-medium-term trading decisions, price action and chart patterns reflect what buyers and sellers are actually doing right now.
What are the best technical indicators for beginners?
Moving averages, RSI, and MACD are the three most widely recommended starting points. Moving averages identify trend direction, RSI signals overbought or oversold conditions, and MACD tracks momentum through moving average crossovers.
How do I reduce risk using technical analysis?
Place your stop-loss at a logically justified price level based on your chart, and limit risk to 1-2% of your account per trade. Technical analysis tells you where you’re wrong on a trade, which is where your stop belongs.
Can technical analysis be used on any market?
Yes. The core principles of trend, support, resistance, and pattern recognition apply across forex, stocks, commodities, indices, and cryptocurrencies. The tools are the same; the specific behavior of each market requires some adjustment in how you apply them.