TL;DR:
- Most traders lose not from a lack of discipline but from misreading market direction or reacting too late to profitable moves. Building a layered, repeatable analysis process that combines macro, technical, and sentiment data enhances trend accuracy and reduces false signals. Recognizing market regimes and applying discipline in execution are crucial for sustainable trading success.
Most traders don’t lose because they lack discipline. They lose because they misread the market’s direction, or worse, they spot a move too late to act on it profitably. Learning how to analyze market trends isn’t about finding a magic indicator. It’s about building a layered, repeatable process that filters signal from noise across macro context, price structure, and sentiment data. This guide breaks down exactly how to do that, from the tools you need to the step-by-step methodology that separates traders who consistently read markets well from those who constantly chase them.
Table of Contents
- Key takeaways
- How to analyze market trends: the tools you need first
- Steps to analyze market trends methodically
- Understanding market regimes and adapting your strategy
- Common mistakes that undermine trend analysis
- Putting trend analysis into trading decisions
- My honest take on market trend analysis
- Start applying your analysis with Ollatrade
- FAQ
Key takeaways
| Point | Details |
|---|---|
| Layer your analysis | Combine macro context, technical signals, and sentiment data for higher-confidence trend reads. |
| Preprocess your data | Detrend, remove outliers, and neutralize seasonality before applying any analysis model. |
| Validate with three filters | Every trend signal should meet convergence, persistence, and amplification criteria before you act. |
| Know your market regime | Momentum, mean reversion, and crisis regimes require fundamentally different trading approaches. |
| Keep execution disciplined | Position sizing and stop placement should reflect regime conditions, not just entry signals. |
How to analyze market trends: the tools you need first
Before you run a single analysis, you need the right inputs. Garbage data produces garbage signals, and most traders skip this step entirely.
The four core data types you should track are price, volume, volatility, and order flow. Price alone tells you where the market has been. Volume confirms whether moves carry conviction. Volatility reveals whether you’re in a trending or choppy environment. Order flow tells you who is driving price. Together, they give you a multi-dimensional view of what the market is actually doing.
Macroeconomic data belongs in your toolkit too. Professional futurists and institutional traders track policy and regulatory changes with an 18 to 24 month lead time, well ahead of what any price chart reflects. Central bank communications, employment reports, and inflation releases all feed into the macro layer that underlies every tradable trend.
On the technical side, your core toolkit should include:
- Moving averages (20, 50, and 200 period) for baseline trend direction
- RSI (Relative Strength Index) to identify momentum strength and divergence
- Bollinger Bands for volatility context and squeeze setups
- Fibonacci retracements for high-probability support and resistance zones
- Volume-weighted indicators such as OBV or VWAP to confirm institutional participation
Sentiment tools round out the picture. Engagement velocity on platforms like TikTok has been shown to predict trend momentum weeks before traditional sales or price data confirms it. For traders in crypto or consumer-facing sectors, social listening tools can serve as genuine leading indicators.
Finally, clean your data before you use it. Detrending, removing outliers, and adjusting for seasonality matters more to signal quality than any model complexity you add on top. Use year-over-year comparisons to neutralize seasonal distortions rather than raw period-over-period readings.
Pro Tip: When using the Ollatrade advanced charting platform, layer at least two independently derived signals before treating any price move as a meaningful trend. Confirmation from separate indicator families reduces false entries significantly.
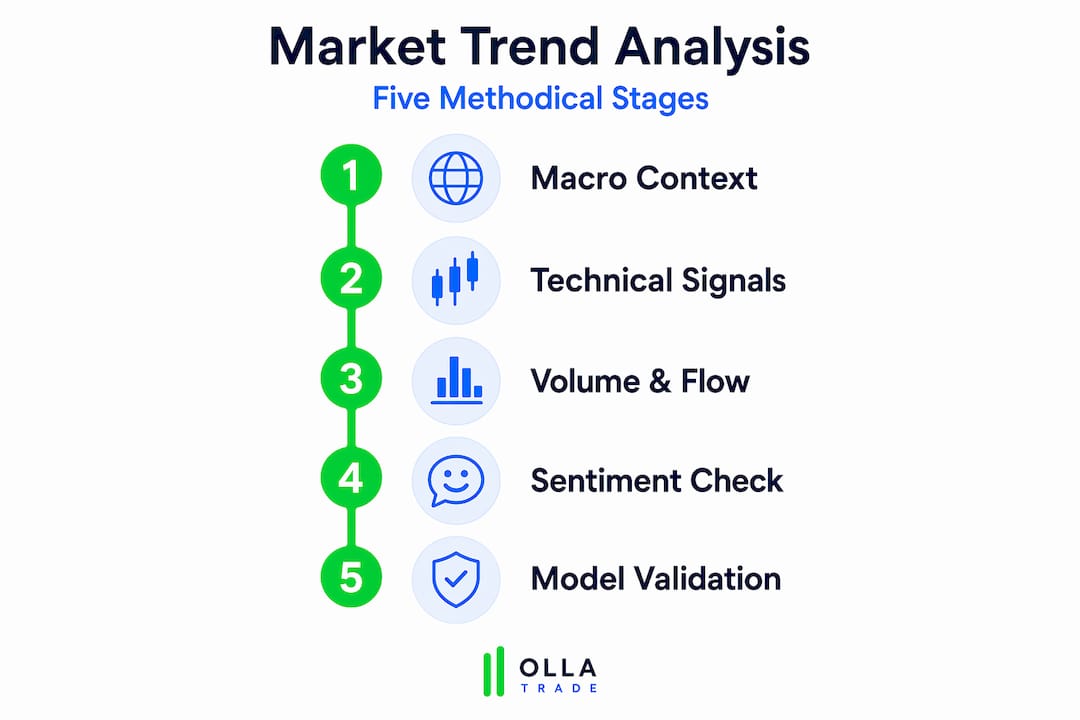
Steps to analyze market trends methodically
Understanding market trend analysis at a conceptual level is one thing. Building a process you can run consistently is another. Here is a reproducible methodology you can apply across forex, indices, and CFD markets.
-
Define your objective and time frame. Are you looking for a swing trade setup over days, a position trade over weeks, or a macro theme over months? Your analysis depth changes with your horizon. Mixing signals from different time frames without a framework is one of the most common causes of conflicting reads.
-
Collect and integrate your data sources. Pull price and volume data, overlay relevant macro releases from an economic calendar, and check sentiment data from options markets or social sources. Structured quantitative data and unstructured qualitative data both belong in the mix.
-
Apply the three-part validation filter. A reliable trend signal passes all three checks: convergence, persistence, and amplification. Convergence means multiple independent signals agree. Persistence means the signal has held across at least several bars or sessions. Amplification means the signal is gaining, not losing, momentum.
-
Use momentum guardrails before committing capital. Three consecutive weeks of positive velocity combined with non-decelerating acceleration is the standard threshold that signals a trend worth investigating further. Anything short of that is noise until proven otherwise.
-
Incorporate lead-lag adjustments. Not all signals fire at the same time. Bond yields often lead equity risk appetite by days to weeks. Currency pairs can front-run commodity price moves. Mapping these relationships in your markets gives you a timing edge that pure price-action traders lack.
-
Combine qualitative and quantitative signals to build a confidence score. Assign weight to each signal type and require a minimum threshold before acting. A trend that shows up in price structure, macro data, and sentiment is a much higher-probability trade than one that only appears in price.
Pro Tip: Successful forecasting in financial markets follows the same layered sequence every time: macro context first, sentiment second, technical structure third, and risk sizing last. Reversing that order is a common and expensive mistake.
Understanding market regimes and adapting your strategy
Not every trend analysis method works in every market environment. The single biggest variable that determines whether a strategy wins or loses is the regime you’re operating in, not the strategy itself.

Markets exhibit three primary regimes that directly impact how you should trade:
| Regime | Key features | Best-fit approach |
|---|---|---|
| Momentum | Trending price action, high persistence, positive serial correlation | Trend-following, breakout entries |
| Mean reversion | Range-bound, low volatility, high correlation breakdown | Fade extremes, tight range targets |
| Crisis | Volatility spike, correlation breakdown, liquidity shrinkage | Reduce size, hedge, or step aside |
Sequencing matters here as much as identification. Crisis periods are followed by compression 73% of the time, and momentum regimes follow crisis 67% of the time. That sequencing pattern alone tells you when to start scaling back into trend-following exposure after a drawdown period.
Most regime detection models fail because traders feed them the wrong inputs. Moving averages and RSI are almost useless as regime features. The inputs that actually work are volatility ratios, correlation eigenvalues, and order flow persistence. These capture the structural properties of a regime, not just the surface price behavior.
When it comes to retraining detection models, monthly retraining beats daily retraining because it avoids overfitting on short-term noise while keeping the model calibrated to genuine structural shifts. Daily retraining creates false regime signals that lead to whipsaw strategy switches.
Adjust your position sizing and stop placement whenever the regime shifts. In momentum regimes, wider stops and larger size make sense because the trend is doing the work. In mean reversion regimes, tighter targets and smaller size are the right structure. In crisis conditions, your only job is capital preservation.
Common mistakes that undermine trend analysis
Even traders who know the methodology well fall into these traps. Recognizing them in your own process is more useful than any new tool you could add.
- Confusing noise for trend. Short-term price spikes, one-off data surprises, and media-driven moves often look like trends but disappear within days. Requiring persistence and amplification filters catches most of these before they cost you.
- Ignoring seasonality. Raw month-over-month comparisons in currency or commodity markets often produce signals that are entirely seasonal in origin. Always compare against the same period in prior years.
- Single-indicator reliance. Any indicator used in isolation generates too many false signals to be tradable. Confluence across independent signal types is non-negotiable. Trend analysis requires explicit uncertainty measurement with confidence intervals, not just a directional call.
- Skipping out-of-sample testing. A model that fits historical data perfectly but has never been tested on data it hasn’t seen is just memorizing the past. Every analytical approach you use should be validated on at least one out-of-sample period before you trade it.
- Overfitting to recent conditions. If you optimize a model to recent market behavior without accounting for regime shifts, it will fail as soon as the regime changes. Knowing your chart patterns and signals well enough to recognize when they stop working is as important as knowing when they work.
- Ignoring risk management as an afterthought. Trend analysis tells you what the market might do. Risk management determines whether you survive being wrong. They are equally important and must be designed together.
Putting trend analysis into trading decisions
Analysis only has value when it produces better trades. Here is how to convert your trend reads into actual execution.
-
Formulate a written trading plan before entry. State the trend thesis, the regime you believe you’re in, the entry trigger, the stop loss level, and the target. Writing it down forces clarity and prevents post-hoc rationalization.
-
Size positions according to volatility and regime. Use ATR (Average True Range) to calibrate stop distance and derive position size. In high-volatility regimes, smaller size with the same ATR multiple maintains consistent risk exposure across changing conditions.
-
Use leading indicators for timing. Bond yield spreads, options skew, and sentiment surveys often lead price by days or weeks. Build these into your entry timing rather than waiting for price confirmation alone.
-
Monitor forecast accuracy systematically. Keep a log of your trend reads and their outcomes. Track how often your signals were right, at what time horizons, and under what regime conditions. This feedback loop is how analysis improves over time.
-
Adjust when conditions change. If your model is generating signals that keep failing, that is a regime-change signal in itself. Pause, reassess the regime, and recalibrate before deploying capital again. Consider the full spectrum of trading strategies available to you and match the approach to the current environment.
-
Protect capital above all else. Position sizing discipline and risk management practices are not just defensive tools. They are what keeps you in the game long enough for good analysis to compound into meaningful returns.
My honest take on market trend analysis
I’ve spent years watching traders build increasingly complex analysis systems, only to get outperformed by simpler, more adaptive approaches. The pattern is consistent enough that I now consider it a rule.
The traders I’ve seen navigate regime transitions best are not the ones with the most sophisticated models. They are the ones who stay humble about what their models can and cannot do. Forecasting doesn’t require exotic mathematics. It requires a stable preprocessing pipeline and an honest relationship with model limitations.
What actually separates good trend analysts from great ones is the speed at which they recognize when their framework has stopped working. That recognition requires ego to be completely absent from the analysis process. The market doesn’t care how much time you spent building your model.
The other shift I’d push back on conventional wisdom about: don’t treat sentiment data as a soft or secondary signal. In the current environment, engagement velocity on social platforms and options market positioning are often more predictive than price-based indicators. Ignoring these data streams because they feel unorthodox is a real edge left on the table.
Disciplined execution beats perfect signals every time. You will be wrong about trends. The traders who survive and grow are the ones whose risk controls are tight enough that being wrong costs little, and whose systems are sharp enough that being right pays well.
— FX
Start applying your analysis with Ollatrade
Knowing how to identify market trends is only half the equation. The other half is having a platform capable of executing on that analysis with precision and speed.
Ollatrade gives retail and professional traders access to forex and CFD markets across currencies, metals, indices, energies, and cryptocurrencies, all within a platform built for serious market analysis. The integrated economic calendar keeps your macro layer updated in real time. Advanced charting tools support the technical analysis methods covered in this guide, including moving averages, RSI, Bollinger Bands, and custom indicators. Whether you’re learning to read trends or refining an existing system, Ollatrade’s step-by-step trading execution guide helps you convert analysis into consistent, disciplined trades.
FAQ
What are the first steps to analyze market trends?
Start by defining your time frame and objective, then collect price, volume, macro, and sentiment data. Apply a three-part validation filter covering convergence, persistence, and amplification before treating any signal as tradable.
How do I avoid false trend signals?
Preprocess your data by detrending and adjusting for seasonality, require confirmation from multiple independent indicators, and always validate your approach on out-of-sample data. Single-indicator signals generate too many false positives to trade reliably.
What tools are best for market trend analysis?
A combination of moving averages, RSI, Bollinger Bands, and volume indicators covers the technical layer. Pair these with an economic calendar for macro context and sentiment tools for early trend detection. Most professional traders use all three layers together.
How do market regimes affect trend analysis?
Momentum, mean reversion, and crisis regimes each require different analysis approaches and position-sizing rules. Regime sequencing patterns mean that a crisis is often followed by compression, then momentum, so identifying the current regime helps you anticipate what comes next.
How often should I update my trend analysis models?
For regime detection models, monthly retraining strikes the right balance between staying calibrated and avoiding noise-driven overfitting. For your broader analysis process, review your forecast accuracy log weekly and adjust when signals consistently underperform.