संक्षेप में:
- चार्टिंग के माध्यम से बाजार के व्यवहार का विश्लेषण किया जाता है, जिसमें कीमतों के आंकड़ों को दृश्य रूप में प्रस्तुत करके रुझानों और पैटर्न की पहचान की जाती है।.
- सभी प्रकार की परिसंपत्तियों में पैटर्न की पहचान और व्यापार के समय का निर्धारण करने के लिए कैंडलस्टिक चार्ट को प्राथमिकता दी जाती है।.
- प्रभावी ट्रेडिंग में चार्ट सिग्नल, वॉल्यूम, बाजार की स्थिति और सख्त जोखिम प्रबंधन का संयोजन आवश्यक है।.
कई व्यापारी मूल्य चार्ट को देखते हैं और उसमें बेतरतीब रेखाएं और आकृतियां देखते हैं। लेकिन वास्तव में वे हर उस भय, लालच, झिझक और दृढ़ विश्वास का रिकॉर्ड देख रहे होते हैं जिसने बाजार को प्रभावित किया है।. ट्रेडिंग में चार्टिंग यह विज़ुअल प्राइस डेटा का उपयोग करके बाज़ार के व्यवहार का विश्लेषण करने, रुझानों को पहचानने, सपोर्ट और रेजिस्टेंस लेवल की पहचान करने और ऐसे पैटर्न को समझने की एक विधि है जो आपके अगले कदम को निर्देशित करते हैं। चाहे आप फॉरेक्स पेयर्स, टेक स्टॉक्स या बिटकॉइन में ट्रेड करें, चार्टिंग के सिद्धांत एक जैसे ही होते हैं। यह गाइड आपको चार्ट के प्रकार, उन्हें पढ़ने का तरीका, उनकी सीमाओं को समझने का तरीका और उन्हें एक कारगर रणनीति में शामिल करने का तरीका बताती है।.
विषयसूची
- ट्रेडिंग में चार्टिंग क्या है?
- चार्ट के प्रकार: लाइन चार्ट, बार चार्ट और कैंडलस्टिक चार्ट की व्याख्या
- चार्ट पढ़ना: मुख्य अवधारणाएँ, पैटर्न और संकेत
- व्यवहार में चार्टिंग: सीमाएं और वास्तविक दुनिया से संबंधित विचार
- ट्रेडिंग रणनीति में चार्टिंग का उपयोग करना
- अधिकांश व्यापारी चार्ट का गलत इस्तेमाल क्यों करते हैं—और आप इसे सही तरीके से कैसे कर सकते हैं
- एडवांस्ड चार्टिंग से शुरुआत करें—अपनी ट्रेडिंग क्षमता को अनलॉक करें
- अक्सर पूछे जाने वाले प्रश्नों
चाबी छीनना
| बिंदु | विवरण |
|---|---|
| चार्टिंग से अंतर्दृष्टि प्राप्त होती है | चार्ट का उपयोग करने से कीमतों में होने वाले उतार-चढ़ाव और बाजार की मानसिकता को समझने में मदद मिलती है, जिससे आप अधिक आत्मविश्वास के साथ व्यापार कर सकते हैं।. |
| कई प्रकार के चार्ट मायने रखते हैं | लाइन चार्ट, बार चार्ट और कैंडलस्टिक चार्ट, ये सभी अद्वितीय जानकारी प्रदान करते हैं—अपनी ट्रेडिंग आवश्यकताओं के लिए सही चार्ट चुनें।. |
| पैटर्न को पुष्टि की आवश्यकता होती है | केवल चार्ट पैटर्न के आधार पर ही निर्णय न लें; अधिक विश्वसनीय ट्रेड के लिए वॉल्यूम और अन्य डेटा से पुष्टि करें।. |
| चार्टिंग की सीमाओं को जानें | चार्ट संभावनाओं को दर्शाते हैं, निश्चितताओं को नहीं, इसलिए इन्हें हमेशा अन्य विश्लेषण और जोखिम प्रबंधन के साथ मिलाकर ही उपयोग करें।. |
| अपनी योजना में चार्टिंग का उपयोग करें | एंट्री और एग्जिट के समय का पता लगाने के लिए चार्टिंग का उपयोग करें, लेकिन इसे एक व्यापक, अनुशासित ट्रेडिंग रणनीति में एकीकृत करें।. |
ट्रेडिंग में चार्टिंग क्या है?
चार्टिंग सिर्फ सुंदर ग्राफों का संग्रह नहीं है। यह समय के साथ कीमतों द्वारा बताई गई कहानी को समझने का एक व्यवस्थित तरीका है। चार्ट पर प्रत्येक बार, कैंडल या लाइन खरीदारों और विक्रेताओं के बीच विशिष्ट कीमतों पर हुए वास्तविक लेन-देन को दर्शाती है। जब आप इसे समझ जाते हैं, तो चार्ट अमूर्त दृश्य मात्र नहीं रह जाते, बल्कि बाजार की जानकारी का स्रोत बन जाते हैं।.
मूल रूप से, चार्टिंग में मूल्य डेटा को रेखाओं, बार या कैंडलस्टिक का उपयोग करके दृश्य रूप से दर्शाया जाता है। इसका उद्देश्य बार-बार दोहराए जाने वाले पैटर्न और व्यवहारों को पहचानना है जो आपके प्रवेश और निकास निर्णयों में मार्गदर्शन कर सकते हैं। चूंकि बाजार मानव मनोविज्ञान से संचालित होते हैं, इसलिए शेयर बाजारों में दशकों पहले बने पैटर्न आज भी क्रिप्टो जोड़ियों में दिखाई देते हैं।.
शेयरों, विदेशी मुद्रा और क्रिप्टोकरेंसी में मूल्य आंदोलनों का विश्लेषण करने और व्यापार के अवसरों को पहचानने के लिए चार्टिंग आवश्यक है। इसकी सर्वव्यापकता ही इसकी सबसे शक्तिशाली विशेषताओं में से एक है। आप एक बार यह कौशल सीख लेते हैं और इसे हर जगह लागू कर सकते हैं।.
यहां बताया गया है कि चार्टिंग आपको क्या करने में मदद करती है:
- बाजार की दिशा का पता लगाएं (ऊपर की ओर, नीचे की ओर या स्थिर रूप से रुझान)
- मूल्य स्तरों की पहचान करें जहां खरीदार या विक्रेता बार-बार आते रहे हैं
- पैटर्न को पहचानें जो संभावित निरंतरता या उलटफेर का संकेत देते हैं
- समय प्रविष्टियाँ और निकास अनुमान लगाने की तुलना में अधिक सटीकता के साथ
- जोखिम का प्रबंधन करें उचित मूल्य स्तरों पर स्टॉप-लॉस ऑर्डर लगाकर
चार्ट भविष्य की भविष्यवाणी नहीं करते। वे आपको यह दिखाते हैं कि क्या हो चुका है और यह उजागर करते हैं कि किस स्थिति में एक परिणाम की संभावना दूसरे की तुलना में अधिक है। निश्चितता से संभाव्यता की ओर सोचने का यही बदलाव अनुशासित व्यापारियों को जुआरियों से अलग करता है।.
आपको जिन दृश्य संकेतों का व्यावहारिक अवलोकन प्राप्त होगा, उसके लिए, चार्ट पैटर्न चीट शीट इससे आपकी पैटर्न पहचानने की क्षमता में तेजी से सुधार हो सकता है। यदि आप उन व्यापक टूलकिट का पता लगाना चाहते हैं जिन पर डे ट्रेडर निर्भर करते हैं, तो देखें... डे ट्रेडिंग के लिए उपकरण और रणनीतियाँ जो चार्ट विश्लेषण के साथ अच्छी तरह से मेल खाते हैं।.
चार्ट के प्रकार: लाइन चार्ट, बार चार्ट और कैंडलस्टिक चार्ट की व्याख्या
चार्टिंग को परिभाषित करने के बाद, आइए विभिन्न प्रकार के मूल्य चार्टों को समझते हैं जिनका उपयोग आप व्यवहार में करेंगे। प्रत्येक प्रकार आपको अलग-अलग स्तर की जानकारी प्रदान करता है, और सही चार्ट का चुनाव आपकी ट्रेडिंग शैली और आपकी आवश्यकताओं पर निर्भर करता है।.
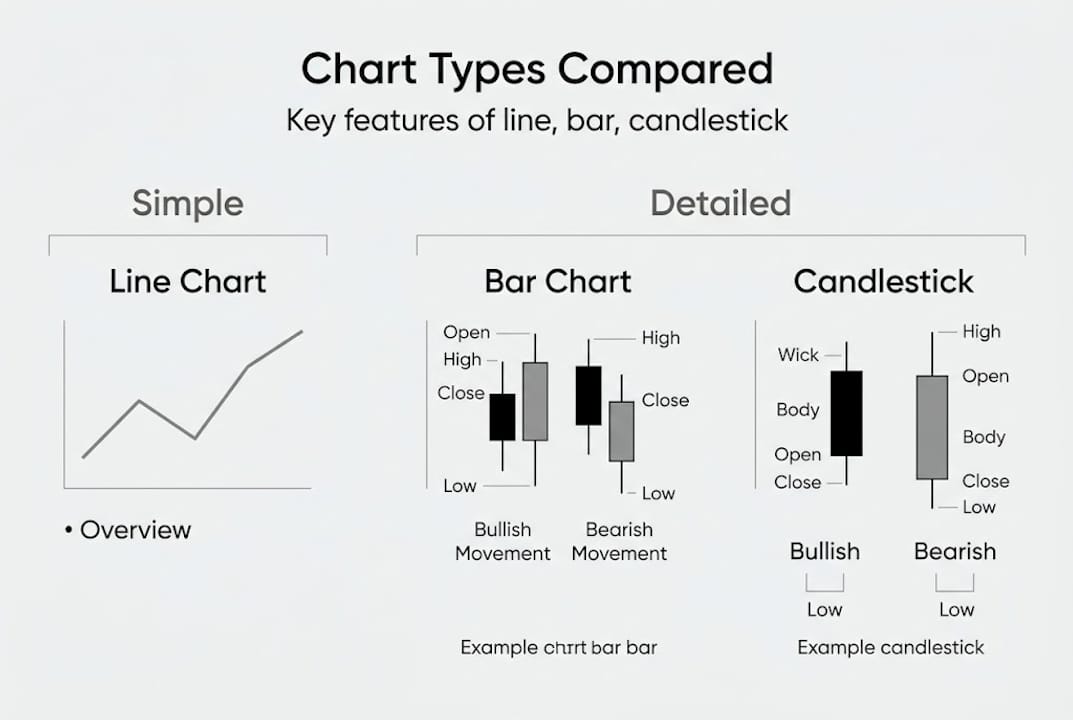
सामान्य चार्ट प्रकारों में शामिल हैं सरल रुझानों का अवलोकन करने के लिए लाइन चार्ट, खुलने, उच्च, निम्न और बंद होने के डेटा को दर्शाने वाले बार चार्ट और विस्तृत जानकारी और पैटर्न की पहचान के लिए सबसे लोकप्रिय कैंडलस्टिक चार्ट।.
तीन मुख्य प्रकार के चार्ट की तुलना:
| चार्ट प्रकार | डेटा प्रदर्शित किया गया | इसके लिए सर्वोत्तम उपयोग किया जाता है | जटिलता |
|---|---|---|---|
| रेखा चार्ट | केवल समापन मूल्य | समग्र रुझान की दिशा का पता लगाना | कम |
| बार चार्ट | खुला, ऊँचा, नीचा, बंद | विस्तृत मूल्य सीमा विश्लेषण | मध्यम |
| कैंडलस्टिक चार्ट | खुला, ऊँचा, नीचा, बंद + रंग | पैटर्न पहचान, ट्रेड का समय निर्धारण | मध्यम ऊँचाई |
यहां प्रत्येक प्रकार के प्रभावी होने का संक्षिप्त विवरण दिया गया है:
- लाइन चार्ट ये आपके शुरुआती बिंदु हैं। ये एक निश्चित अवधि में समापन कीमतों को आपस में जोड़ते हैं, जिससे आपको बिना किसी शोर-शराबे के समग्र रुझान का स्पष्ट अवलोकन मिलता है। व्यापक परिदृश्य को समझने के लिए ये बहुत उपयोगी हैं।.
- बार चार्ट हम आपको प्रति अवधि चार डेटा बिंदु प्रदान करते हैं। प्रत्येक ऊर्ध्वाधर पट्टी उच्चतम और निम्नतम मान दर्शाती है, जिसमें छोटे क्षैतिज चिह्न खुले (बाएं) और बंद (दाएं) मानों को चिह्नित करते हैं। अधिक जानकारी, अधिक संदर्भ।.
- कैंडलस्टिक चार्ट बार चार्ट की तरह ही ओपन, हाई, लो और क्लोज डेटा दिखाएं, लेकिन इसमें रंग जोड़ें। हरे या सफेद रंग की कैंडल का मतलब है कि कीमत ओपनिंग प्राइस से ज़्यादा पर बंद हुई। लाल या काले रंग की कैंडल का मतलब है कि कीमत कम पर बंद हुई। यह कलर कोडिंग पैटर्न को तुरंत समझने में मदद करती है।.
कैंडलस्टिक चार्ट सभी परिसंपत्ति वर्गों में अधिकांश सक्रिय व्यापारियों के लिए पसंदीदा प्रारूप है क्योंकि वे गति को दृश्य रूप से दर्शाते हैं। व्यापार मात्रा इन चार्टों के साथ-साथ मौजूद जानकारी आपके द्वारा देखी गई बातों की पुष्टि की एक और परत जोड़ती है।.
सलाह: पहले दिन से ही कैंडलस्टिक चार्ट से शुरुआत करें। पैटर्न को पहचानने में इनसे मिलने वाली स्पष्टता सीखने में लगने वाले थोड़े समय के बावजूद बहुत फायदेमंद है, और आप पाएंगे कि ऑनलाइन चार्टिंग सिखाने वाले अधिकांश पाठ्यक्रम में इनका ही उपयोग किया जाता है। अधिक जानकारी के लिए ट्रेडिंग चार्ट की व्याख्या करना विभिन्न बाजार स्थितियों में, गहन अध्ययन करना आपके समय के लिए लाभदायक होगा।.
चार्ट पढ़ना: मुख्य अवधारणाएँ, पैटर्न और संकेत
चार्ट के प्रकारों को समझने के बाद, अगला कदम यह सीखना है कि उन चार्टों से क्या संकेत मिल रहे हैं। संदर्भ के बिना कच्चे मूल्य डेटा का कोई मतलब नहीं है। संकेतों को समझने के लिए आपको एक ढांचा चाहिए।.
प्रवृत्तियों ये हर चीज़ की बुनियाद हैं। तेज़ी के रुझान में उच्चतम और निम्नतम स्तर अधिक होते हैं। हर उछाल कीमत को पिछले शिखर से ऊपर ले जाता है, और हर गिरावट पिछले निम्नतम स्तर से ऊपर बनी रहती है। गिरावट का रुझान इसका ठीक उल्टा होता है: उच्चतम और निम्नतम स्तर कम होते हैं। रुझान की दिशा में ट्रेडिंग करने से आपको किसी भी पैटर्न को देखे बिना ही सांख्यिकीय बढ़त मिल जाती है।.

समर्थन और प्रतिरोध ये वो मूल्य स्तर हैं जहाँ खरीदार और विक्रेता बार-बार आपस में टकराते हैं। सपोर्ट वो न्यूनतम मूल्य स्तर है जहाँ खरीदारी ने ऐतिहासिक रूप से कीमतों को वापस ऊपर धकेला है। रेजिस्टेंस वो अधिकतम मूल्य स्तर है जहाँ बिकवाली के दबाव ने तेजी को सीमित किया है। ये स्तर सटीक संख्याएँ नहीं हैं बल्कि क्षेत्र हैं, और कैंडलस्टिक पैटर्न की पहचान के साथ-साथ सपोर्ट और रेजिस्टेंस की पहचान जैसी प्रमुख चार्टिंग विधियाँ अधिकांश तकनीकी ट्रेडिंग रणनीतियों की रीढ़ की हड्डी बनती हैं।.
यहां कुछ महत्वपूर्ण कैंडलस्टिक पैटर्न का सारांश दिया गया है जिन्हें जानना उपयोगी होगा:
| पैटर्न का नाम | प्रकार | संकेत |
|---|---|---|
| बुलिश एनगल्फिंग | उलटफेर | गिरावट के बाद संभावित तेजी |
| सुबह का तारा | उलटफेर | तीन कैंडल का बुलिश सिग्नल |
| टूटता तारा | उलटफेर | तेजी के बाद संभावित गिरावट |
| हथौड़ा | उलटफेर | गिरावट के बाद खरीदार आगे आए |
| दोजी | असमंजस | बाजार संतुलन में है, तेजी पर नजर रखें |
इन पैटर्न को जानना पहला कदम है। इन पर बुद्धिमानी से अमल करना दूसरा कदम है।.
- हमेशा प्रतीक्षा करें इसकी सूचना देने वाला किसी पैटर्न के आधार पर व्यापार में प्रवेश करने से पहले
- बनने वाले पैटर्न की तलाश करें प्रमुख समर्थन या प्रतिरोध स्तरों पर
- उच्च संभावना वाले सेटअप के लिए पैटर्न संकेतों को वॉल्यूम के साथ मिलाएं।
- अपने विचारों को परिभाषित करने के लिए पैटर्न का उपयोग करें जोखिम, न केवल आपका लक्ष्य
यह समझने के लिए कि पैटर्न वास्तविक व्यापार में कैसे परिवर्तित होते हैं, आगे पढ़ें। ट्रेडिंग चार्ट पैटर्न और उनकी वास्तविक सफलता दर उपयोगी परिप्रेक्ष्य प्रदान करती है। और चार्ट रीडिंग को इसके साथ जोड़ना भी उपयोगी है। आवश्यक व्यापार रणनीतियाँ यह आपको अलग-अलग संकेतों के बजाय एक संपूर्ण प्रणाली प्रदान करता है।.
सलाह: बिना पुष्टि के कोई भी पैटर्न सिर्फ एक आकृति होता है। पूंजी लगाने से पहले हमेशा अगली कैंडलस्टिक के बंद होने का इंतजार करें जो आपके अनुमान का समर्थन करे।.
व्यवहार में चार्टिंग: सीमाएं और वास्तविक दुनिया से संबंधित विचार
अब जब आप चार्ट पढ़ना सीख चुके हैं, तो वास्तविक ट्रेडिंग में चार्ट की सीमाओं और आम गलतियों को पहचानना बेहद ज़रूरी है। कोई भी उपकरण परिपूर्ण नहीं होता, और चार्टिंग भी इसका अपवाद नहीं है।.
अस्थिर बाज़ारों में गलत संकेत मिलना आम बात है, बार-बार सपोर्ट या रेजिस्टेंस को छूने से समय के साथ उनकी शक्ति कम हो जाती है, और क्रिप्टो की चौबीसों घंटे ट्रेडिंग से गैपलेस लेकिन अत्यधिक अस्थिर चार्ट बनते हैं। ये कोई अपवाद नहीं हैं। ये नियमित रूप से होते हैं।.
यहां कुछ सबसे महत्वपूर्ण सीमाएं दी गई हैं जिन्हें ध्यान में रखना आवश्यक है:
- बाजार में स्थिरता से अस्थिरता उत्पन्न होती है।. जब कीमतें एक सीमित दायरे में लगातार ऊपर-नीचे होती रहती हैं, तो कई पैटर्न पूरी तरह से लागू नहीं हो पाते। स्थिर बाजारों में ट्रेंड-फॉलोइंग सेटअप ठीक से काम नहीं करते।.
- बार-बार परीक्षण करने से समर्थन और प्रतिरोध दोनों कमजोर हो जाते हैं।. किसी स्तर को बार-बार बिना टूटे परखने की कोशिश करने पर, उसके अंततः टूटने की संभावना उतनी ही बढ़ जाती है। चार्टिंग में, परिचितता कमजोरी को जन्म देती है।.
- कम आवाज़ से सिग्नल विकृत हो जाते हैं।. कम वॉल्यूम पर ब्रेकआउट अक्सर एक जाल होता है। अधिक वॉल्यूम इस बात की पुष्टि करता है कि इस कदम के पीछे वास्तविक दृढ़ विश्वास है।.
- क्रिप्टो की 24/7 प्रकृति रातोंरात होने वाले अंतराल को खत्म कर देती है।. शेयर बाजार में, सत्रों के बीच का अंतराल मजबूती या कमजोरी का संकेत दे सकता है। क्रिप्टोकरेंसी में यह गतिशीलता नहीं होती, जिससे कुछ पारंपरिक पैटर्न कम विश्वसनीय हो जाते हैं।.
- पश्चदृष्टि पूर्वाग्रह वास्तव में मौजूद है।. घटना घटित होने के बाद ही पैटर्न स्पष्ट दिखाई देते हैं। वास्तविक समय में, उन्हें स्पष्ट रूप से पहचानना कहीं अधिक कठिन होता है।.
चार्टिंग अल्पकालिक तकनीकी विश्लेषण के लिए सर्वोत्तम उपकरणों में से एक है, लेकिन यह भविष्य की कीमतों की गारंटी नहीं दे सकता है और हमेशा वॉल्यूम, फंडामेंटल्स या अन्य तरीकों से पुष्टि की आवश्यकता होती है।.
इसका व्यावहारिक उत्तर यह है कि चार्टिंग का उपयोग कभी भी अकेले न करें। चार्ट संकेतों को समाचार घटनाओं, आर्थिक विज्ञप्तियों या मूलभूत डेटा के साथ मिलाकर उपयोग करने से कई गलत धारणाओं को दूर किया जा सकता है। आप अन्य विकल्पों का भी पता लगा सकते हैं। सीएफडी ट्रेडिंग रणनीतियाँ जो तकनीकी और मूलभूत इनपुट को एकीकृत करते हैं, या जांच करते हैं चार्टिंग स्वचालन उपकरण जो एल्गोरिदम के माध्यम से उच्च संभावना वाले परिदृश्यों को चिह्नित करते हैं, जिससे भावनात्मक पूर्वाग्रह कम होता है।.
ट्रेडिंग रणनीति में चार्टिंग का उपयोग करना
खूबियों और कमियों को समझने के बाद, अब समय आ गया है कि बिंदुओं को आपस में जोड़ा जाए: आपको अपनी वास्तविक दुनिया की रणनीति में चार्टिंग का उपयोग कैसे करना चाहिए?
चार्टिंग तकनीकें सभी परिसंपत्ति वर्गों में ट्रेडिंग को प्रभावित करती हैं, लेकिन मौलिक विश्लेषण और ठोस जोखिम प्रबंधन के साथ मिलकर ये सबसे अच्छा काम करती हैं। शुरुआत करने के लिए यहां एक व्यावहारिक ढांचा दिया गया है:
- सबसे पहले रुझान की पहचान करें।. किसी भी पैटर्न को देखने से पहले, यह निर्धारित करें कि आपके प्राथमिक समयसीमा पर बाजार तेजी, मंदी या एक सीमित दायरे में है या नहीं।.
- प्रमुख समर्थन और प्रतिरोध क्षेत्रों को चिह्नित करें।. ऐतिहासिक रूप से महत्वपूर्ण रहे मूल्य स्तरों को दर्शाने के लिए क्षैतिज रेखाओं का उपयोग करें।.
- किसी महत्वपूर्ण स्तर पर पैटर्न की प्रतीक्षा करें।. उच्च संभावना वाली स्थितियाँ तब उत्पन्न होती हैं जब कैंडलस्टिक पैटर्न ठीक उस समर्थन या प्रतिरोध क्षेत्र पर बनता है जो प्रवृत्ति के अनुरूप होता है।.
- वॉल्यूम के साथ पुष्टि करें।. क्या वॉल्यूम इस चाल का समर्थन करता है? बढ़ते वॉल्यूम के साथ होने वाला ब्रेकआउट कम वॉल्यूम वाले ब्रेकआउट की तुलना में कहीं अधिक विश्वसनीय होता है।.
- बुनियादी बातों की जांच करें।. क्या कोई ऐसी बड़ी समाचार घटना या आर्थिक घोषणा है जो आपके तकनीकी सेटअप को अमान्य कर सकती है?
- प्रवेश करने से पहले अपने जोखिम को परिभाषित करें।. अपना स्टॉप-लॉस एक तार्किक स्तर पर रखें, आमतौर पर उस पैटर्न से थोड़ा आगे जो आपके ट्रेड को ट्रिगर करता है।.
- इसे अपनी योजना में लिख लें।. हर ट्रेड सेटअप, एंट्री, एग्जिट और उसके कारण को रिकॉर्ड करें। समय के साथ विकसित अनुशासन ही लगातार ट्रेडिंग करने वालों को प्रतिक्रियात्मक ट्रेडर्स से अलग करता है।.
सलाह: छठे चरण को कभी न छोड़ें। स्टॉप-लॉस लगाना अनिवार्य है। यही आपको घाटे वाले ट्रेड को विनाशकारी नुकसान से बचाता है।.
फॉरेक्स-विशिष्ट अनुप्रयोगों के लिए, अन्वेषण करना सिद्ध फॉरेक्स रणनीतियाँ वास्तविक उदाहरणों के साथ यह दिखाया गया है कि ये चार्टिंग सिद्धांत वास्तविक मुद्रा बाजारों में कैसे काम करते हैं।.
अधिकांश व्यापारी चार्ट का गलत इस्तेमाल क्यों करते हैं—और आप इसे सही तरीके से कैसे कर सकते हैं
एक कड़वी सच्चाई यह है: चार्ट का इस्तेमाल करके पैसा गंवाने वाले अधिकांश व्यापारी खराब चार्ट का इस्तेमाल नहीं कर रहे होते हैं। वे अच्छे चार्ट का गलत तरीके से इस्तेमाल कर रहे होते हैं। सबसे आम गलती यह है कि बिना किसी अन्य पुष्टि के किसी एक पैटर्न को ही खरीद या बिक्री का संकेत मान लेना। किसी भी कीमत स्तर पर हैमर कैंडलस्टिक का लगभग कोई मतलब नहीं होता। लेकिन अगर वही हैमर कैंडलस्टिक किसी मजबूत सपोर्ट ज़ोन पर, औसत से अधिक वॉल्यूम के साथ और तेजी के अनुकूल मूलभूत कारकों के साथ दिखाई दे, तो यह एक अच्छा संकेत है।.
दूसरी गलती है संदर्भ को नज़रअंदाज़ करना। एक मज़बूत गिरावट के दौर में तेज़ी का पैटर्न बाज़ार के रुझानों के विपरीत होता है। संदर्भ हमेशा पैटर्न से ज़्यादा महत्वपूर्ण होता है। अनुभवी व्यापारी व्यापक बाज़ार परिवेश के संदर्भ में चार्ट का अध्ययन करते हैं और परिस्थितियों में बदलाव के अनुसार अपनी व्याख्या को समायोजित करते हैं।.
चार्ट को संपूर्ण उत्तर नहीं, बल्कि एक व्यापक निर्णय प्रक्रिया में एक इनपुट के रूप में देखें। जो ट्रेडिंग उपकरण और रणनीतियाँ लगातार कारगर साबित होती हैं, वे तकनीकी संकेतों को विवेक, धैर्य और जोखिम प्रबंधन के साथ जोड़ती हैं। यही संयोजन वास्तविक लाभ प्रदान करता है।.
एडवांस्ड चार्टिंग से शुरुआत करें—अपनी ट्रेडिंग क्षमता को अनलॉक करें
यदि आप अपने चार्टिंग कौशल को वास्तविक बाजारों में लागू करने के लिए तैयार हैं, तो उद्योग के अग्रणी ट्रेडिंग प्लेटफॉर्म शुरुआत करना आसान बनाते हैं।.
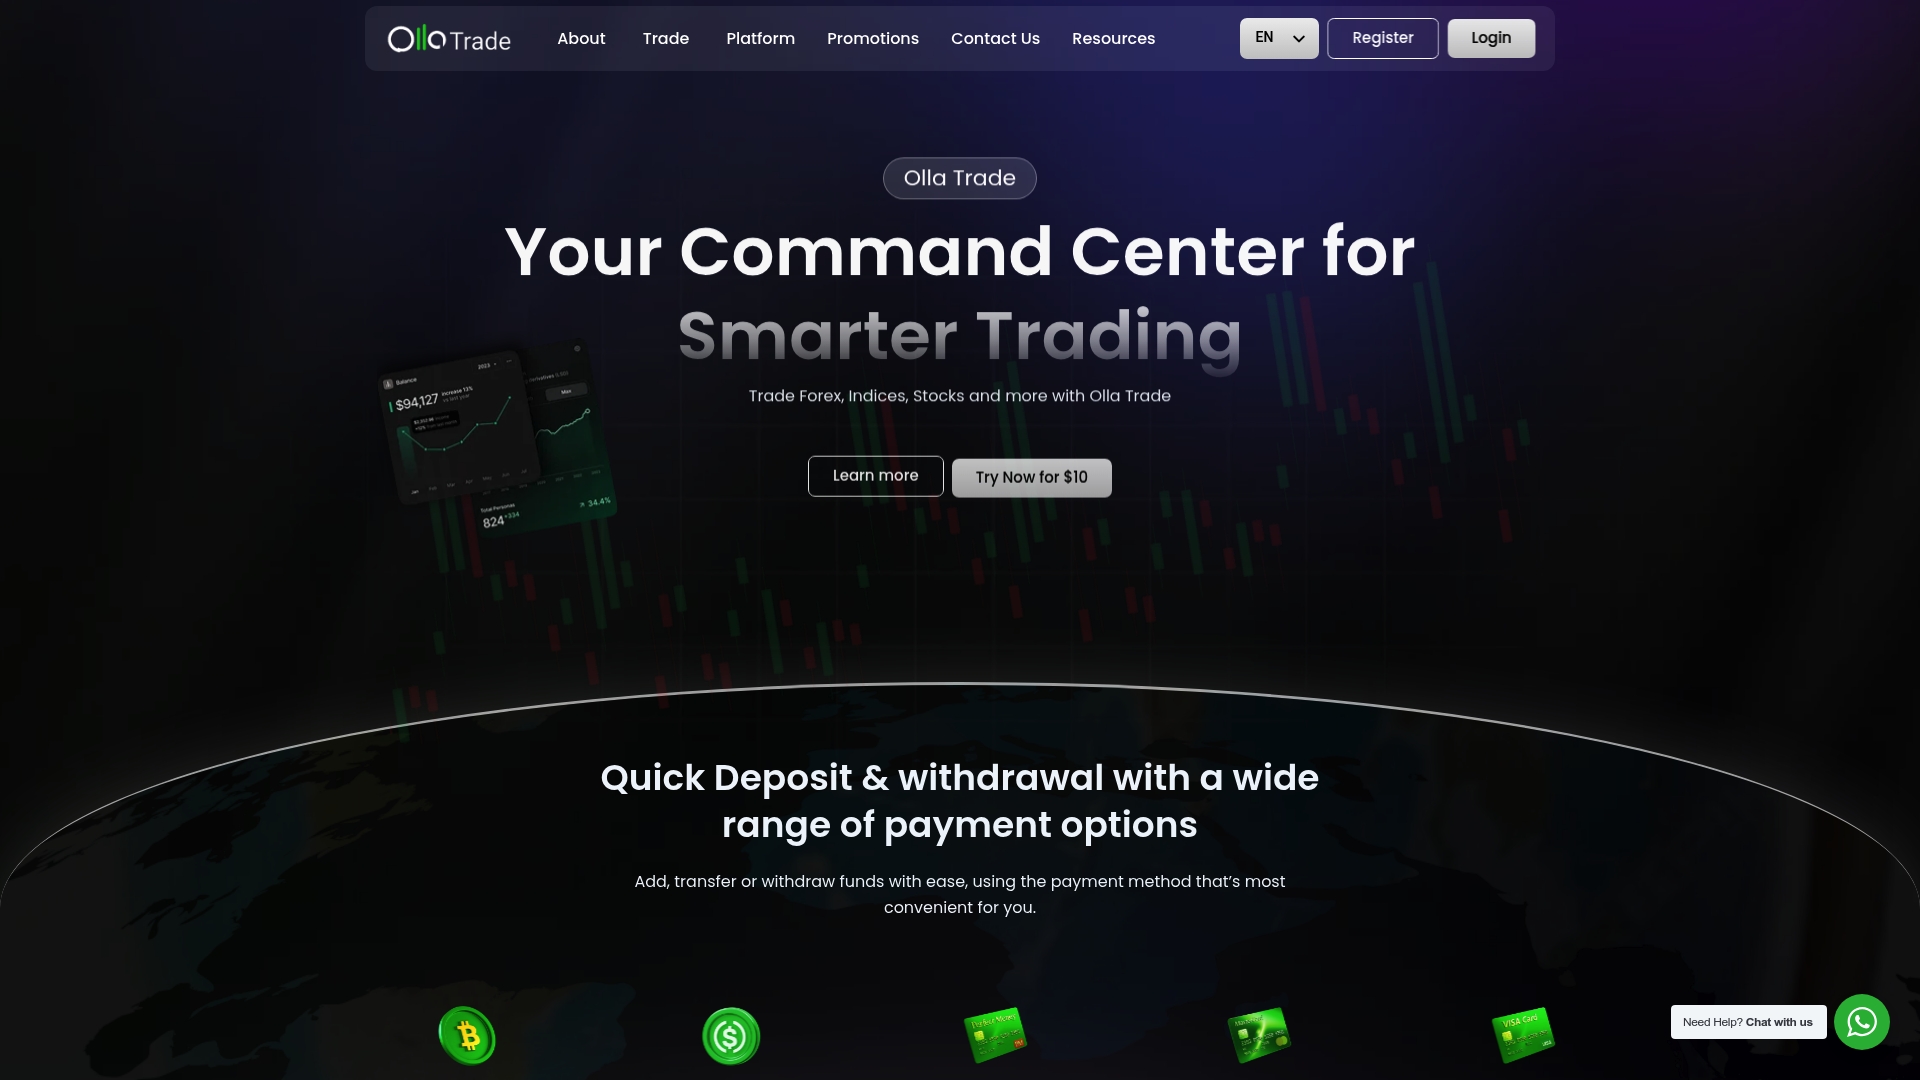
ओला ट्रेड आपको एक ही प्लेटफॉर्म पर फॉरेक्स, सीएफडी, इंडेक्स, धातु और क्रिप्टोकरेंसी सहित सभी क्षेत्रों के लिए पेशेवर स्तर के चार्टिंग टूल तक पहुंच प्रदान करता है। विदेशी मुद्रा व्यापार के अवसर मल्टी-एसेट सीएफडी रणनीतियों से लेकर, यह प्लेटफॉर्म एक ट्रेडर के रूप में आपके विकास के हर चरण में आपका समर्थन करने के लिए बनाया गया है। यदि आप अभी भी यह तय कर रहे हैं कि कहां ट्रेड करना है, तो एक लेख पढ़ना आपके लिए उपयोगी हो सकता है। ट्रेडिंग प्लेटफॉर्मों के लिए गाइड यह आपको यह समझने में मदद करेगा कि एक विश्वसनीय, सुविधाओं से भरपूर वातावरण में क्या देखना चाहिए। सटीक स्प्रेड, तेज़ निष्पादन और एकीकृत चार्टिंग टूल का मतलब है कि आप अपने प्लेटफ़ॉर्म से जूझने में कम समय और अपनी रणनीति पर ध्यान केंद्रित करने में अधिक समय व्यतीत करेंगे।.
अक्सर पूछे जाने वाले प्रश्नों
ट्रेडिंग में चार्टिंग का उद्देश्य क्या है?
चार्टिंग व्यापारियों को कीमतों में होने वाले उतार-चढ़ाव का दृश्य विश्लेषण करने में मदद करती है, जिससे वे रुझान, पैटर्न और महत्वपूर्ण समर्थन या प्रतिरोध स्तरों की पहचान कर सकते हैं, और अधिक समझदारीपूर्ण और जानकारीपूर्ण व्यापारिक निर्णय ले सकते हैं।.
व्यापारी सबसे अधिक किस प्रकार के चार्ट का उपयोग करते हैं?
अधिकांश व्यापारी रुझान का अवलोकन करने के लिए लाइन चार्ट, ओएचएलसी डेटा के लिए बार चार्ट और विस्तृत मूल्य गतिविधि विश्लेषण और पैटर्न पहचान के लिए कैंडलस्टिक चार्ट का उपयोग करते हैं।.
क्या स्टॉक, फॉरेक्स और क्रिप्टोकरेंसी के लिए चार्टिंग तकनीकें समान हैं?
हां, मूल सिद्धांत तीनों पर लागू होते हैं, हालांकि क्रिप्टो चार्ट बिना किसी अंतराल के 24/7 चलते हैं, जबकि स्टॉक चार्ट में रातोंरात कीमतों में अंतराल दिख सकते हैं जो अतिरिक्त तकनीकी महत्व प्रदान करते हैं।.
क्या चार्ट किसी परिसंपत्ति के भविष्य के मूल्य की भविष्यवाणी कर सकते हैं?
नहीं। चार्ट पिछले व्यवहार के आधार पर पैटर्न और संभावित चालों को उजागर करते हैं, लेकिन भविष्य में कीमत की कोई गारंटी नहीं होती है, इसलिए अन्य उपकरणों से पुष्टि और सख्त जोखिम प्रबंधन आवश्यक हो जाता है।.
चार्ट का उपयोग करते समय ट्रेडर कौन सी सबसे आम गलतियाँ करते हैं?
बिना पुष्टि के केवल कैंडलस्टिक पैटर्न पर भरोसा करना, बाजार के संदर्भ को अनदेखा करना और जोखिम प्रबंधन की अनदेखी करना सबसे बड़ी गलतियाँ हैं। पूंजी लगाने से पहले हमेशा संकेतों की पुष्टि करें।.