
بسیاری از معاملهگران تصور میکنند که معاملات شاخصها فقط راه دیگری برای معامله سهام انفرادی است، اما این یک سوءتفاهم اساسی است. شاخصها در معاملات روزانه روشی برای سنجش عملکرد کلی گروهی از سهام به جای تمرکز بر شرکتهای منفرد ارائه میدهند. این تمایز مهم است زیرا شاخصها مزایای تنوعبخشی ارائه میدهند که موقعیتهای تک سهام به سادگی نمیتوانند با آن برابری کنند. این راهنما توضیح میدهد که معاملات شاخصها در واقع شامل چه مواردی است، چگونه قراردادهای مابهالتفاوت دسترسی به بازار را امکانپذیر میکنند و کدام تکنیکهای استراتژیک میتوانند عملکرد معاملاتی شما را در سال 2026 افزایش دهند. شما بینشهای عملی در مورد روشهای وزندهی، شاخصهای بازار جهانی و عوامل ساختاری که پویایی قیمتگذاری را هدایت میکنند، به دست خواهید آورد.
فهرست مطالب
- معاملات شاخصها چیست و چرا اهمیت دارد؟
- درک CFDها و نقش آنها در معاملات شاخصها
- روشهای وزندهی و شاخصهای اصلی جهانی که باید در سال ۲۰۲۶ مورد توجه قرار گیرند
- بینشهایی از قیمتگذاری قراردادهای آتی شاخص و پویایی بازار در سال 2026
- معاملات شاخصها را با اولا ترید بررسی کنید
نکات کلیدی
| نقطه | جزئیات |
|---|---|
| مزیت تنوعبخشی | شاخصها، ریسک را بین چندین سهم پخش میکنند و ریسکهای خاص شرکت را که موقعیتهای سهام انفرادی را تحت تأثیر قرار میدهند، کاهش میدهند. |
| انعطافپذیری CFD | قراردادهای مابهالتفاوت، امکان سفتهبازی قیمت را بدون مالکیت دارایی فراهم میکنند و اهرم مالی و الزامات سرمایهای کمتری را ارائه میدهند. |
| وزن بر حرکت تأثیر میگذارد | روشهای وزنی قیمت، وزنی ارزش بازار و وزنهای برابر، نحوه واکنش مقادیر شاخص به تغییرات سهام را تعیین میکنند. |
| شاخصهای احساسات جهانی | شاخصهای اصلی مانند داو جونز، FTSE 100 و DAX منعکسکننده روانشناسی بازار گستردهتر و سلامت اقتصادی هستند. |
| پیچیدگی قیمتگذاری قراردادهای آتی | عوامل ساختاری از جمله فشار پوشش ریسک و نابرابریهای نقدینگی، پویاییهای قیمتگذاری منحصر به فردی را در بازارهای آتی شاخص ایجاد میکنند. |
معاملات شاخصها چیست و چرا اهمیت دارد؟
شاخصها به عنوان فشارسنجهای بازار عمل میکنند و چندین سهام را در یک ابزار قابل معامله واحد ترکیب میکنند که نشان دهنده عملکرد بخش، کشور یا کل اقتصاد است. وقتی شما یک شاخص را معامله میکنید، به جای شرطبندی روی سرنوشت یک شرکت، روی حرکت جمعی بازار موضع میگیرید. این رویکرد اساساً مشخصات ریسک شما را تغییر میدهد.
در مقایسه با معامله سهام تکی، شاخصها ریسکهای خاص شرکت را کاهش میدهند زیرا نشاندهنده کسبوکارهای زیادی هستند. گزارش درآمد ضعیف از یک شرکت تشکیلدهنده، کل موقعیت شما را به اندازه زمانی که مستقیماً آن سهام را نگه میداشتید، تضعیف نمیکند. اثر تنوعبخشی، نوسانات را کاهش میدهد و سیگنالهای واضحتری در مورد روندهای گستردهتر بازار ارائه میدهد.
شاخصها همه چیز را از بخشهای فناوری گرفته تا بازارهای نوظهور و کل اقتصادهای ملی پوشش میدهند. S&P 500 شرکتهای بزرگ آمریکایی را دنبال میکند، در حالی که Nikkei 225 سلامت بازار ژاپن را اندازهگیری میکند. این تنوع به شما امکان میدهد معاملات را با دیدگاه بازار خود هماهنگ کنید بدون اینکه دهها شرکت جداگانه را بررسی کنید.
مزایای کلیدی برای معاملهگران عبارتند از:
- کاهش مواجهه با ریسک ورشکستگی یا رسوایی تکشرکتی
- گمانهزنی آسانتر در مورد روندهای اقتصاد کلان و تأثیرات سیاستها
- نوسانات کمتر در مقایسه با موقعیتهای سهام انفرادی
- تحلیل سادهشده با تمرکز بر مبانی بخش یا کشور
- همبستگی بهتر با شاخصهای اقتصادی و تغییرات احساسات
رابطه بین معاملات شاخصها و احساسات بازار عمیق است. وقتی سرمایهگذاران نسبت به رشد اقتصادی خوشبین هستند، شاخصهای بازار گسترده معمولاً افزایش مییابند. برعکس، ترس، سرمایه را از داراییهای ریسکی خارج میکند و شاخصها را به سمت پایین سوق میدهد. درک شاخصهای بازار سهام چارچوبی برای تفسیر این تغییرات احساسی به شما میدهد.
یک تصور غلط رایج این است که شاخصها برای ایجاد بازده معنادار، بسیار کلی هستند. واقعیت خلاف این را ثابت میکند. شاخصها میتوانند در طول فصلهای درآمد، اعلامیههای سیاست یا رویدادهای ژئوپلیتیکی به شدت تغییر کنند. تفاوت کلیدی این است که تحلیل شما بر عوامل کلی به جای معیارهای فردی شرکت متمرکز است.
آشنایی با CFDها و نقش آنها در معاملات شاخصها
قراردادهای مابهالتفاوت، نحوه دسترسی معاملهگران خرد به بازارهای شاخص را متحول کردند. CFD یک قرارداد مشتقه است که در آن شما موافقت میکنید تفاوت بین قیمتهای آغازین و پایانی یک دارایی را مبادله کنید. شما هرگز مالک شاخص اصلی نیستید، بلکه صرفاً در حال گمانهزنی در مورد جهت قیمت هستید.
شاخصهای معاملاتی اغلب شامل قراردادهای مابهالتفاوت هستند که به معاملهگران اجازه میدهند بدون داشتن سهام اصلی، روی تغییرات قیمت گمانهزنی کنند. این مکانیسم پیچیدگی و الزامات سرمایهای خرید هر سهام تشکیلدهنده در یک شاخص را از بین میبرد. در عوض، شما یک موقعیت را نزد کارگزاری باز میکنید که ریسک قیمت را فراهم میکند.
CFDها از طریق چندین مزیت قدرتمند، معاملات شاخصها را تسهیل میکنند. اهرم، میزان ریسکپذیری شما در بازار را افزایش میدهد و به شما این امکان را میدهد که موقعیتهای بزرگتری را با سرمایهگذاریهای کوچکتر کنترل کنید. نسبت اهرم 10:1 به این معنی است که یک سپرده $1,000، یک موقعیت $10,000 را کنترل میکند. این امر سود و زیان را افزایش میدهد و مستلزم مدیریت دقیق ریسک است.
الزامات سرمایه کمتر، دسترسی به شاخصهای جهانی را همگانی میکند. شما میتوانید بدون نیاز به دهها هزار دلار، شاخصهای DAX، Nikkei یا FTSE 100 را معامله کنید. اکثر کارگزاران، اندازههای لات کسری ارائه میدهند و به شما این امکان را میدهند که با موقعیتهایی مطابق با اندازه حساب و تحمل ریسک خود شروع کنید.
دسترسی انعطافپذیر به شاخصهای جهانی به این معنی است که میتوانید در ساعات کاری اروپا در بازارهای آسیا معامله کنید یا از هر کجای دنیا شاهد تغییرات شاخصهای ایالات متحده باشید. ارائهدهندگان CFD معمولاً ساعات معاملاتی طولانیتری نسبت به جلسات سنتی بورس ارائه میدهند. اطلاعات بیشتر در مورد قراردادهای معاملات تفاضلی مکانیک و کاربردها.
نکات مهم هنگام معامله CFD:
- اسپردها تفاوت بین قیمت خرید و فروش را نشان میدهند و مستقیماً بر سودآوری تأثیر میگذارند.
- الزامات مارجین بسته به کارگزار و شاخص متفاوت است و بر تصمیمات مربوط به اندازه موقعیت تأثیر میگذارد.
- هزینههای تأمین مالی شبانه برای موقعیتهای نگهداری شده فراتر از روز معاملاتی اعمال میشود.
- ساعات بازار در شاخصهای مختلف متفاوت است و این امر فرصتها و شکافهایی را در نقدینگی ایجاد میکند.
- حمایتهای نظارتی بسته به حوزه قضایی و ثبت کارگزاری متفاوت است
نکته حرفهای: تقویمهای اقتصادی و تحولات سیاسی مؤثر بر شاخصهای انتخابی خود را زیر نظر داشته باشید. اطلاعیههای بانک مرکزی، انتشار تولید ناخالص داخلی و نتایج انتخابات میتوانند باعث نوسانات شدید شوند. اندازه موقعیت باید این خطرات رویداد را در نظر بگیرد، به خصوص هنگام نگه داشتن موقعیتهای شبانه.
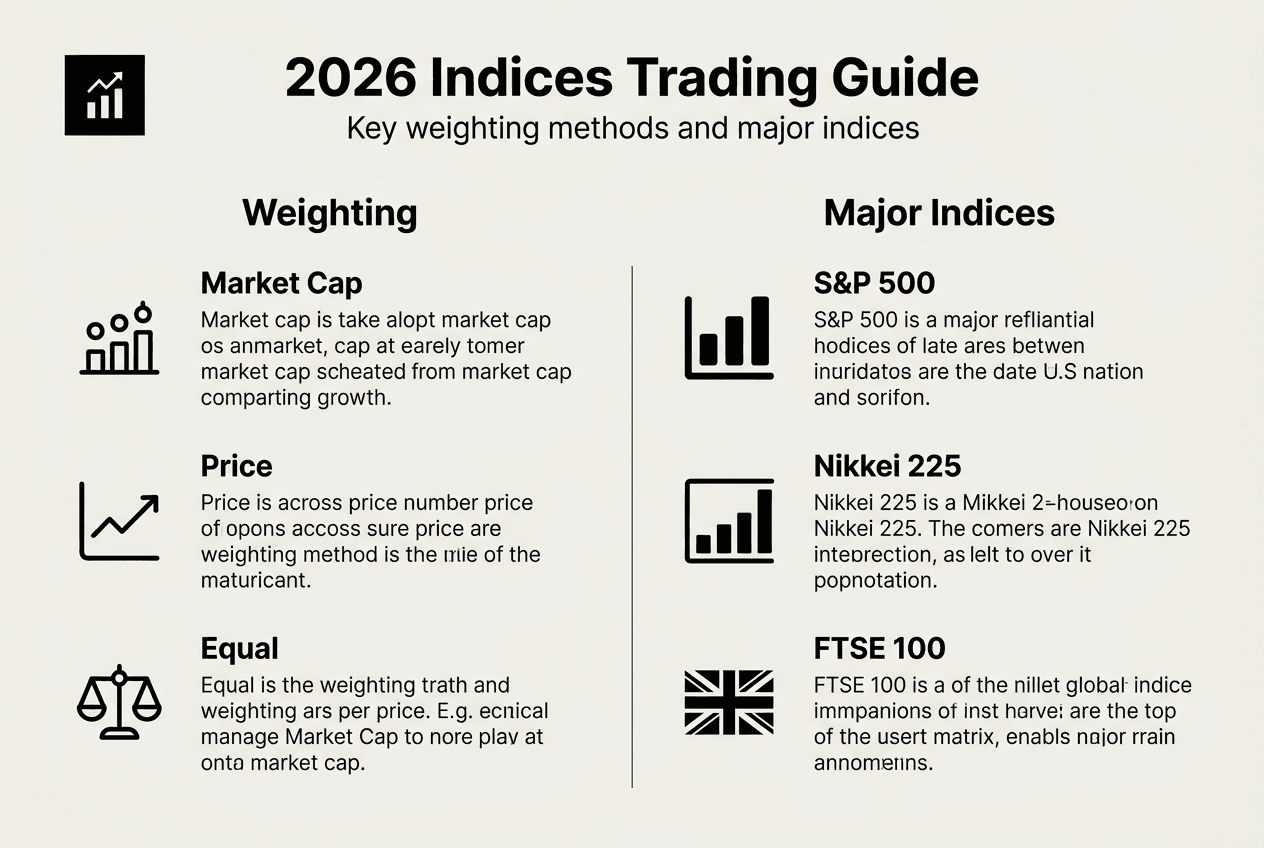
روشهای وزندهی و شاخصهای اصلی جهانی که باید در سال ۲۰۲۶ مورد توجه قرار گیرند
نحوه محاسبه ارزش یک شاخص، به طور چشمگیری بر اینکه کدام سهام باعث حرکت قیمت میشوند، تأثیر میگذارد. شاخصها با استفاده از روشهای وزندهی مختلفی از جمله وزندهی بر اساس قیمت، وزندهی بر اساس ارزش بازار و وزندهی برابر محاسبه میشوند. هر روش، ویژگیهای عملکردی و فرصتهای معاملاتی متمایزی را ایجاد میکند.
شاخصهای وزنی قیمت مانند میانگین صنعتی داو جونز، صرف نظر از اندازه شرکت، به سهام با قیمت بالاتر تأثیر بیشتری میدهند. یک سهم با شاخص $300، شاخص را بیشتر از یک سهم با شاخص $50 حرکت میدهد، حتی اگر سهم ارزانتر، ارزش بازار بیشتری داشته باشد. این میتواند موقعیتهای متناقضی ایجاد کند که در آن شرکتهای کوچکتر، عملکرد شاخص را هدایت میکنند.
شاخصهای وزنی بر اساس ارزش بازار مانند S&P 500، اجزای تشکیلدهنده را بر اساس ارزش کل بازار وزن میدهند. شرکتهای بزرگتر مانند اپل یا مایکروسافت تأثیر زیادی بر حرکات شاخص دارند. این امر واقعیت اقتصادی را بهتر از وزندهی قیمت منعکس میکند، اما میتواند منجر به ریسک تمرکز شود، زمانی که چند شرکت بزرگ بر بازار تسلط دارند.

شاخصهای با وزن یکسان، صرف نظر از قیمت یا ارزش بازار، به هر جزء تشکیلدهنده، اهمیت یکسانی میدهند. این رویکرد، پوشش وسیعتری از بازار را فراهم میکند، اما برای حفظ وزنهای برابر در هنگام واگرایی قیمتهای سهام، نیاز به تعدیل مکرر دارد.
| روش وزندهی | مبنای محاسبه | فهرست مثال | ویژگی کلیدی |
|---|---|---|---|
| وزنی بر اساس قیمت | قیمت سهام | میانگین صنعتی داو جونز | سهام با قیمت بالاتر، حرکات بازار را تحت سلطه خود دارند |
| وزن بازار بر اساس ارزش بازار | ارزش بازار شرکت | شاخص S&P 500، نزدک کامپوزیت | بزرگترین شرکتها عملکرد را هدایت میکنند |
| وزن برابر | تخصیص برابر | وزن برابر S&P 500 | همه اجزا به طور مساوی مشارکت دارند |
شاخصهای جهانی محبوب مانند داو جونز، FTSE 100، DAX و Nasdaq Composite احساسات بازار خود را منعکس میکنند. در اینجا شاخصهای کلیدی برای نظارت در سال 2026 آورده شده است:
- میانگین صنعتی داو جونز: 30 سهام برتر ایالات متحده که نشاندهنده قدرت صنعتی و اقتصادی هستند
- FTSE 100: 100 شرکت برتر در بورس اوراق بهادار لندن، که به شدت به سمت امور مالی و انرژی گرایش دارند
- دکس: ۴۰ شرکت بزرگ آلمانی به عنوان پیشاهنگ اقتصادی منطقه یورو عمل میکنند
- نزدک کامپوزیت: بیش از ۳۰۰۰ سهم با تمرکز سنگین بر بخش فناوری
- سنسکس: ۳۰ شرکت بزرگ هندی، پویایی رشد بازارهای نوظهور را رصد میکنند
- شاخص CAC 40: چهل شرکت بزرگ سهامی عام فرانسه که عملکرد قاره اروپا را منعکس میکنند
- یورو استاکس ۵۰: سهام ممتاز از ۱۱ کشور منطقه یورو که در معرض دید گسترده اروپاییها قرار دارند
هر شاخص اصلی به عنوان یک شاخص احساسات بازار برای منطقه خود عمل میکند. عملکرد DAX نشاندهنده سلامت تولید اروپا است، در حالی که Nasdaq نشاندهنده اعتماد به بخش فناوری است. درک این روابط به شما کمک میکند تا معاملات را در چارچوب روایتهای اقتصادی جهانی قرار دهید. جزئیات را بررسی کنید نمای کلی شاخصها برای فرصتهای معاملاتی.
روش وزندهی بر استراتژی معاملاتی شما تأثیر میگذارد. شاخصهای وزنی قیمت به شدت به حرکات بالای قیمت سهام واکنش نشان میدهند و فرصتهایی را در اطراف سود یا اقدامات شرکتها ایجاد میکنند که بر اجزای گرانقیمت تأثیر میگذارند. شاخصهای وزنی ارزش بازار توجه به سود و راهنمایی شرکتهای بزرگ را میطلبند. شاخصهای وزنی برابر، سیگنالهای چرخش بخش تمیزتری را ارائه میدهند.
نکته حرفهای: انتخاب شاخص را با بازه زمانی معاملاتی و دیدگاه بازار خود مطابقت دهید. معاملهگران کوتاهمدت از شاخصهای پرنوسان و فناوری محور مانند نزدک سود میبرند. معاملهگران موقعیتی که به دنبال ریسک اقتصادی هستند، ممکن است شاخصهای گستردهتر و پایدارتری مانند S&P 500 یا FTSE 100 را ترجیح دهند. استراتژی شما باید با ویژگیهای ساختاری شاخص همسو باشد.
بینشهایی از قیمتگذاری قراردادهای آتی شاخص و پویایی بازار در سال 2026
قراردادهای آتی شاخص، لایه دیگری از پیچیدگی و فرصت را به معاملات شاخصها اضافه میکنند. این مشتقات، خریداران و فروشندگان را ملزم به انجام معامله با قیمت از پیش تعیینشده در تاریخ آینده میکنند. قیمتگذاری معاملات آتی، انتظارات بازار و فشارهای ساختاری را آشکار میکند که قیمتهای شاخص لحظهای به طور کامل آنها را در بر نمیگیرند.
نرخ تخفیف سالانه شاخص CSI 1000 Futures به طور چشمگیری از -0.26% در سال 2022 به -1.79% در سال 2025 افزایش یافت و در ژوئیه 2025 به اوج خود یعنی -13.76% رسید. این انحراف شدید بین قیمتهای آتی و نقدی، نشاندهنده مشکلات ساختاری عمیقی فراتر از مکانیک عادی بازار است.
| سال | نرخ تخفیف سالانه قراردادهای آتی CSI 1000 | زمینه بازار |
|---|---|---|
| 2022 | -0.26% | رابطه قیمتگذاری نسبتاً عادی |
| 2023 | -0.89% | گسترش تخفیفهای متوسط آغاز میشود |
| 2024 | -1.34% | فشارهای ساختاری تشدید میشوند |
| 2025 | -1.79% | پایه منفی مداوم گسترش مییابد |
| ژوئیه ۲۰۲۵ | -13.76% | اوج جابجایی شدید |
یافتهها، سازوکارهای ساختاری فراتر از بازده سود سهام را که بر قیمتگذاری آتی و بیثباتی بازار تأثیر میگذارند، برجسته میکند. عوامل متعددی این ناهنجاریهای قیمتگذاری را در معاملات آتی شاخص شرکتهای کوچک هدایت میکنند.
فشارهای پوشش ریسک از سوی سرمایهگذاران نهادی، فروش مداوم در بازارهای آتی را ایجاد میکند. وقتی مدیران صندوقها پرتفویهای بزرگ با سرمایه کم در اختیار دارند، اغلب با فروش استقراضی قراردادهای آتی شاخص، ریسک نزولی را پوشش میدهند. این تقاضای متمرکز پوشش ریسک، قیمتهای آتی را نسبت به شاخصهای نقدی به پایینتر از ارزش منصفانه میرساند.
جبران نوسانات شرکتهای کوچک، حق بیمه ریسک بالاتری را میطلبد. شاخص CSI 1000، شرکتهای کوچکتری را با نوسانات قیمت و عدم قطعیت تجاری بیشتر در مقایسه با شاخصهای شرکتهای بزرگ دنبال میکند. معاملهگران آتی برای این ریسک بالا، غرامت دریافت میکنند که به صورت تخفیفهای گستردهتر خود را نشان میدهد.
محدودیتهای فروش استقراضی در بازارهای سهام چین، پوششدهندگان ریسک را به سمت قراردادهای آتی سوق میدهد. محدودیتهای نظارتی بر فروش استقراضی سهام انفرادی، فعالیت پوشش ریسک را به سمت معاملات آتی شاخص هدایت میکند و باعث عدم تعادل عرضه و تقاضا میشود. این فرصت آربیتراژ نظارتی با چالشهای اجرایی همراه است.
اختلاف نقدینگی بین بازارهای نقدی و آتی، شکافهای قیمتی را تشدید میکند. وقتی بازارهای آتی عمق نداشته باشند، جریانهای بزرگ پوشش ریسک، قیمتها را به طور چشمگیری نسبت به بازارهای نقدشونده تغییر میدهند. این نوسانات قیمتی میتواند مدت طولانیتری از آنچه تئوریهای اقتصادی نشان میدهند، ادامه یابد.
“حلقههای بازخورد پیچیده بین رفتار پوشش ریسک، محدودیتهای نظارتی و ریزساختار بازار، مارپیچهای نوسان خودتقویتکنندهای ایجاد میکنند که مدلهای قیمتگذاری سنتی در ثبت آنها شکست میخورند.”
پیامدهای این موضوع برای معاملهگران فراتر از بازارهای چین است. پویاییهای ساختاری مشابهی در سایر شاخصهای بازارهای نوظهور و معاملات آتی بخشهای تخصصی نیز مشاهده میشود. درک این مکانیسمها به شما کمک میکند تا فرصتهای قیمتگذاری نادرست را شناسایی کرده و از گرفتار شدن در تلههای نوسان جلوگیری کنید.
چگونه این پویاییها بر استراتژی معاملاتی تأثیر میگذارند:
- تخفیفهای شدید در معاملات آتی ممکن است نشاندهندهی معاملات پوشش ریسک بیش از حد و آسیبپذیری آنها در برابر بازگشت روند باشد.
- پایه منفی مداوم، فرصتهای آربیتراژ بالقوهای را برای معاملهگران خبره ایجاد میکند.
- نوسانات شدید اغلب با بینظمی قیمتگذاری معاملات آتی همراه است و توقفهای طولانیتری را میطلبد.
- تغییرات نظارتی میتوانند فوراً روابط قیمتگذاری ساختاری را تغییر دهند
- تحلیل نقدینگی هنگام معاملات آتی روی شاخصهای بازارهای کوچکتر یا نوظهور بسیار مهم میشود.
روابط قیمتگذاری آتی را در شاخصهای معاملهشده خود زیر نظر داشته باشید. گسترش اسپردهای پایه اغلب مقدم بر گسترش نوسانات یا حرکات جهتدار است. برعکس، عادیسازی اسپردها میتواند نشاندهنده ثبات و به معنای فرصتهای بازگشت باشد. عمیقتر شوید بینشهای معاملاتی شاخصها برای کاربرد عملی.
معاملات شاخصها را با Olla Trade کاوش کنید
آمادهاید تا این استراتژیهای معاملاتی شاخصها را در بازارهای واقعی به کار بگیرید؟ اولا ترید (Olla Trade) از طریق CFDها دسترسی جامعی به شاخصهای جهانی ارائه میدهد و مزایای تنوعبخشی مورد بحث در این راهنما را با ابزارهای اجرایی حرفهای ترکیب میکند. این پلتفرم، اسپردهای پایینی را در شاخصهای اصلی از جمله داو جونز، FTSE 100، DAX و Nasdaq Composite به علاوه فرصتهای بازارهای نوظهور ارائه میدهد.
چه در حال تحلیل روشهای وزندهی باشید، چه در حال نظارت بر پویایی قیمتگذاری قراردادهای آتی، یا موقعیتیابی پیرامون انتشار اخبار اقتصادی، ابزارهای پیشرفته نمودارسازی و تحلیلی Olla Trade از تصمیمگیری آگاهانه پشتیبانی میکنند. منابع آموزشی به شما کمک میکنند تا بر تکنیکهای مطرحشده در اینجا، از مکانیک CFD گرفته تا عوامل ساختاری بازار، تسلط پیدا کنید. پلتفرم معاملاتی شاخصها را بررسی کنید تا ببینید چگونه این مفاهیم به معاملات عملی تبدیل میشوند. درک خود را با راهنمای معاملات CFD عمیقتر کنید و مهارتهای خود را از طریق ... ارتقا دهید. آموزش معاملهگری حرفهای مناسب برای فعالان جدی بازار.
سوالات متداول
مزیت اصلی معاملات شاخصها در مقایسه با سهام تکی چیست؟
شاخصها با پخش کردن ریسک در بین سهام مختلف، ریسک شرکتهای مختلف را کاهش میدهند و شما را از ورشکستگی، رسوایی یا درآمد ضعیف از هر یک از اجزای تشکیلدهندهی سهام محافظت میکنند. آنها ردیابی متنوع حرکات بازار را در یک معاملهی واحد ارائه میدهند و تجزیه و تحلیل و اجرا را ساده میکنند. این مزیت ساختاری، شاخصها را برای بیان دیدگاههای گستردهتر بازار بدون نیازهای تحقیقاتی خاص شرکت، ایدهآل میکند.
چگونه CFDها انعطافپذیری معاملاتی با شاخصها را افزایش میدهند؟
CFDها امکان گمانهزنی در مورد تغییرات قیمت را بدون مالکیت داراییهای اساسی شاخصها فراهم میکنند و سرمایه و پیچیدگی خرید تک تک سهام تشکیلدهنده را از بین میبرند. آنها اهرمی ارائه میدهند که میزان مواجهه با بازار را افزایش میدهد، الزامات سرمایه کمتری دارند که دسترسی را دموکراتیک میکند و دسترسی به بازار را در شاخصهای جهانی از یک پلتفرم واحد آسان میکنند. این انعطافپذیری به شما امکان میدهد شاخصهای آسیایی، اروپایی و آمریکایی را صرف نظر از موقعیت مکانی یا اندازه حساب خود معامله کنید.
چه عواملی بر نوسانات قیمت شاخصهای جهانی تأثیر میگذارند؟
دادههای تورم، تصمیمات نرخ بهره و احساسات سرمایهگذاران، تأثیرات عمدهای بر جهت شاخص دارند، زیرا بر انتظارات درآمدی شرکتها و ریسکپذیری آنها تأثیر میگذارند. شاخصهای رشد اقتصادی، فصلهای درآمدی شرکتها و رویدادهای ژئوپلیتیکی، روندهای میانمدت را هدایت میکنند. ویژگیهای ساختاری مانند روشهای وزندهی، تعیین میکنند که کدام سهام بیشترین حرکت را در شاخصها دارند، در حالی که پویایی بازار آتی، از جمله فشار پوشش ریسک و شرایط نقدینگی، ناکارآمدیهای قیمتگذاری کوتاهمدت را ایجاد میکند.
چرا نرخ تنزیل قراردادهای آتی شاخص CSI 1000 در سالهای اخیر افزایش یافته است؟
فشارهای پوشش ریسک تشدید شده از سوی سرمایهگذاران نهادی، فروش در بازارهای آتی را متمرکز کرد، زیرا مدیران پرتفوی به دنبال محافظت در برابر ضرر بودند. با افزایش عدم قطعیت در بازارهای کوچک، تقاضا برای جبران نوسانات افزایش یافت، در حالی که محدودیتهای فروش استقراضی در بازارهای سهام چین، پوششدهندگان ریسک را مجبور به ورود به قراردادهای آتی کرد. اختلاف نقدینگی بین بازارهای نقدی و آتی، نابسامانیهای قیمتی را تشدید کرد و انحرافات ساختاری منحصر به فرد بازار چین را ایجاد کرد که در اواسط سال 2025 به اوج خود رسید.