TL;DR:
- Successful forex technical analysis begins with understanding market structure before applying indicators to avoid false signals. Professionals confirm trends, support, and resistance using one indicator per category while following a disciplined, multi-step workflow that emphasizes patience. Recognizing market phases, session timing, and risks like volatility and leverage is essential for making informed trading decisions and managing capital effectively.
Most traders assume that loading a chart with indicators is what technical forex analysis looks like in practice. It isn’t. The forex market processes over $7.5 trillion in daily trading volume, making it the most liquid financial market on the planet. That scale means price behavior is shaped by forces far more complex than any single indicator can capture. Real technical analysis of forex combines market structure reading, indicator confirmation, and disciplined risk management into one coherent workflow. This guide breaks down exactly how that works.
Table of Contents
- Key Takeaways
- Technical forex analysis starts with market structure
- Core technical analysis tools and how to combine them
- A practical workflow for making trade decisions
- Challenges and risks in forex technical analysis
- Advanced considerations: sessions, liquidity, and market dynamics
- What I’ve learned about technical analysis that most guides won’t tell you
- Apply your analysis with the right platform behind you
- FAQ
Key Takeaways
| Point | Details |
|---|---|
| Structure comes first | Read market structure before applying any indicator to avoid false signals. |
| Use one indicator per category | Combine trend, momentum, and volatility indicators to confirm signals without creating noise. |
| Follow a defined workflow | Apply a repeatable five-step process from structure identification to stop-loss placement. |
| Respect leverage limits | US regulations cap leverage at 50:1 on major pairs; use it cautiously to protect capital. |
| Session timing matters | Volatility patterns are highly stable across sessions, so time your entries accordingly. |
Technical forex analysis starts with market structure
Before you place a single indicator on your chart, you need to understand what price is actually doing. Market structure is the foundation of all professional technical analysis of forex. It tells you whether price is trending, ranging, or transitioning between the two states.
A trending market leaves a clear footprint. In an uptrend, price creates a sequence of higher highs and higher lows. In a downtrend, you see lower highs and lower lows. When that sequence breaks, the market is signaling a potential shift. A ranging market, by contrast, oscillates between a defined ceiling (resistance) and floor (support) without making meaningful directional progress.
Support and resistance zones are where the most significant trade decisions happen. These aren’t arbitrary lines. They represent price levels where buying or selling pressure previously overwhelmed the opposing side, creating memory in the market. When price returns to those zones, the same institutional players often react again.
Price action analysis within those zones gives you the clearest read on what’s likely to happen next. Candlestick patterns like pin bars, engulfing candles, and inside bars at key levels tell you whether buyers or sellers are winning the battle in real time.
Here’s what separates professional traders from retail traders on this point:
- Professionals identify the current market phase (trending, ranging, or transitional) before anything else
- They mark major support and resistance zones on higher timeframes first
- They read candlestick behavior at those zones before considering any indicator signal
- They understand that indicator overload lowers performance and slows decision-making
Pro Tip: Start every analysis session by asking one question: “Is this market trending or ranging?” Your entire strategy framework should change based on the answer.
Core technical analysis tools and how to combine them
Once you understand market structure, indicators become genuinely useful. The mistake most traders make is treating forex technical indicators as predictive tools. They aren’t. Indicators are confirmation tools, not crystal balls. Used correctly, they filter noise and add weight to decisions you’ve already grounded in structure.
Professional traders avoid “indicator overload” by selecting one indicator per category: trend, momentum, and volatility. Here’s how those categories break down.
Trend indicators tell you the direction and strength of the dominant move. Moving averages are the most widely used. A simple moving average (SMA) smooths price over a set period. An exponential moving average (EMA) weights recent prices more heavily, making it more responsive. The MACD measures the relationship between two EMAs to signal momentum shifts. The Ichimoku Cloud gives you trend direction, support/resistance, and momentum in a single overlay.
Momentum indicators measure the speed of price movement and flag overbought or oversold conditions. RSI is the most popular, with readings above 70 suggesting overbought and below 30 suggesting oversold. The Stochastic Oscillator compares closing price to a range over time. CCI (Commodity Channel Index) identifies cyclical turns.
Volatility indicators show how much price is moving, regardless of direction. Bollinger Bands expand during high volatility and contract during low volatility. ATR (Average True Range) gives you a raw measure of volatility useful for stop-loss placement. Keltner Channels work similarly to Bollinger Bands but use ATR instead of standard deviation.
| Indicator type | Best market condition | Accuracy range |
|---|---|---|
| Moving average crossovers | Trending markets | 68–72% |
| RSI and Bollinger Bands | Range-bound markets | 67–71% |
| ATR | All conditions (sizing) | N/A (not directional) |
| MACD | Trending with momentum | Varies by timeframe |
Pro Tip: When the 20, 50, and 200 EMAs align in the same direction across multiple timeframes, trend signal validity increases significantly. That alignment is one of the strongest confirmation signals available to any technical trader.
The most common errors traders make with technical analysis tools:
- Using five or more indicators that all measure the same thing (e.g., RSI, Stochastic, and CCI together)
- Entering trades based on indicator signals alone without confirming market structure
- Ignoring volatility indicators when setting stop-loss distances, leading to stops that are too tight
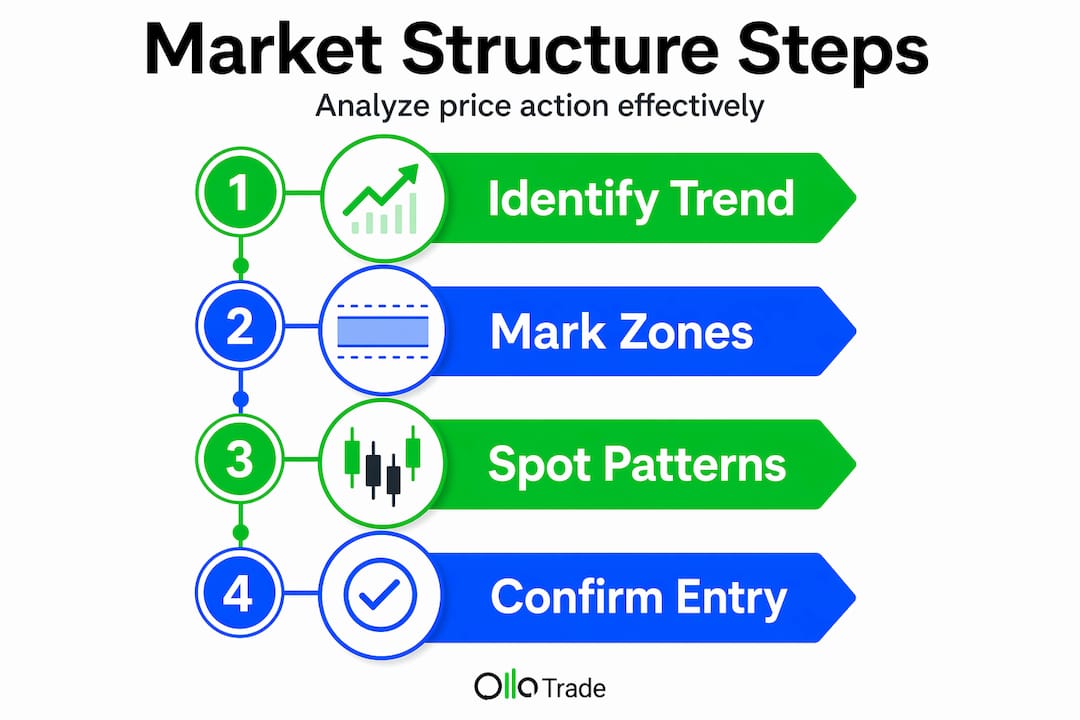
A practical workflow for making trade decisions
Knowing the tools is only half the equation. You need a repeatable process for applying them. Here’s the workflow that professional traders use when conducting advanced forex analysis.
Identify the market phase. Open your chart on a higher timeframe (daily or four-hour) and determine whether price is trending or ranging. This sets the entire context for your analysis.
Establish your directional bias. If the market is trending up, you’re looking for long opportunities. If it’s ranging, you’re looking to sell resistance and buy support. Never fight the dominant structure.
Mark key levels on multiple timeframes. Support and resistance zones on the daily chart carry more weight than those on the 15-minute chart. Mark the major levels first, then drill down to your trading timeframe for precision. Proven forex strategies consistently emphasize this multi-timeframe approach.
Wait for price confirmation near key levels. This is where your indicators earn their place. When price reaches a key support zone in an uptrend, look for a bullish candlestick pattern confirmed by RSI turning up from oversold or MACD crossing bullish. Two or three confirming signals at the same level is a high-probability setup.
Define your risk before you enter. Place your stop-loss at a logical structural level, not at a round number or a fixed pip distance. If price invalidates the structure you identified, the trade thesis is wrong. Your stop should reflect that. Use advanced charting tools to measure ATR and set stops that account for current volatility.
Position sizing follows directly from stop placement. Decide what percentage of your account you’re willing to risk on the trade (typically 1 to 2 percent), then calculate your lot size based on the distance to your stop. This keeps risk consistent regardless of how wide or tight the setup is.
Pro Tip: Patience is the most underrated skill in this workflow. The best setups require price to come to your level, not chasing price into a move that’s already happened.

Challenges and risks in forex technical analysis
Technical analysis works until it doesn’t. Understanding its limits is just as important as mastering its application.
High-impact news events, including central bank rate decisions, non-farm payrolls, and geopolitical shocks, can override every technical signal on your chart in seconds. Price can gap through support and resistance levels as if they don’t exist. During these moments, the rules change, and the best decision is often to stay out.
Leverage is the most dangerous tool in forex trading. US retail forex brokers must comply with leverage caps of 50:1 on major pairs and 20:1 on minor and exotic pairs, along with a FIFO rule that prohibits hedging. These regulations exist for a reason. Excessive leverage turns a small adverse move into a wipeout.
Key risks every trader should account for:
- Stop-loss orders may not execute at expected prices during high volatility periods due to slippage and gaps
- Decentralized FX markets mean execution quality varies across brokers
- Psychological traps like moving stops wider or chasing a missed entry destroy even the best analytical frameworks
- Overconfidence after a winning streak leads traders to increase size before they’ve proven consistency
“Retail forex traders must understand leverage risks and regulatory limits to avoid rapid capital loss.” — Commodity.com
The solution isn’t to avoid forex. It’s to manage trading risk with the same discipline you apply to your technical analysis. Define your maximum risk per trade. Define your maximum drawdown for the week. Then stick to those limits the way a professional athlete sticks to a training plan.
Advanced considerations: sessions, liquidity, and market dynamics
If you want to move beyond basic technical analysis of forex, you need to understand the market’s microstructure. Price doesn’t move randomly throughout the day. Session volatility patterns show a correlation of 0.987 stability over roughly 20 years, meaning institutional norms around when markets are active are deeply entrenched.
The London session and the New York session overlap (roughly 8 a.m. to noon Eastern Time) consistently produces the highest volatility and the most reliable technical setups. The Tokyo session is quieter, with tighter ranges. Professional traders time their entries around these patterns rather than trading at random hours.
Liquidity concentration is another factor that shapes your technical setups. Internalization ratios in major FX hubs reach 80%, meaning most retail trades execute internally against broker books rather than hitting the open interbank market. This affects price transparency and slippage, particularly during off-hours or thin market conditions.
Currency carry trades add another layer of complexity. Carry trades amplify exchange rate moves around central bank policy announcements, which means a technically perfect setup can be overwhelmed by a sudden unwinding of carry positions. Knowing when major central bank decisions are scheduled, using a resource like Ollatrade’s economic calendar, helps you avoid placing trades into that kind of event risk.
Key advanced considerations for professional-level analysis:
- Time entries during peak session overlap for the most reliable technical signals
- Understand that 72% of spot FX executes electronically, but voice trading still holds a 38% share in derivatives, affecting liquidity in correlated markets
- Factor carry trade dynamics into your analysis around central bank meetings
- Use the global events impacting currencies framework to anticipate when fundamental forces may override technical setups
Pro Tip: Mark the London open and the New York open on your chart. A significant portion of daily range is established in the first two hours of each session. Your technical setups near key levels during those windows carry more weight than the same setups at 3 a.m. Eastern Time.
What I’ve learned about technical analysis that most guides won’t tell you
I’ve spent years watching traders build elaborate systems of indicators and then wonder why their results don’t match their backtests. Here’s my honest take: the complexity is usually a form of avoidance. More indicators feel like more certainty. They aren’t.
The traders I’ve seen perform consistently over time share one habit. They spend more time on the “no trade” decision than on the entry decision. They wait for their structure, their level, and their confirmation to align. When all three aren’t present, they don’t trade. That kind of discipline is genuinely rare, and it’s what separates profitable traders from everyone else.
The uncomfortable truth about technical analysis limits is this: during extreme market events, your chart becomes a historical document, not a predictive tool. The 2015 Swiss franc shock, the 2020 COVID crash, the 2022 yen collapse. Every one of those events destroyed technically perfect setups in minutes. Building that awareness into your risk framework isn’t pessimism. It’s professionalism.
My advice is to develop your process before you scale your size. A structured, patient approach applied consistently across 100 trades will tell you far more about your edge than any indicator combination ever will.
— FX
Apply your analysis with the right platform behind you
Understanding technical forex analysis is one thing. Having the tools to apply it in real time is another. Ollatrade’s forex trading platform gives you access to MetaTrader 4 integration, advanced charting features, and a full suite of forex technical indicators built for both retail and professional traders. Whether you’re working through a step-by-step forex trading guide or refining an advanced multi-timeframe strategy, Ollatrade provides tight spreads, fast execution, and the regulatory reliability you need to trade with confidence. Start with the tools that match your ambition.
FAQ
What is technical forex analysis?
Technical forex analysis is the practice of evaluating currency price movements using historical price data, chart patterns, market structure, and indicators to identify trading opportunities. It focuses on what price is doing rather than why it’s doing it.
Which technical indicators work best for forex trading?
Moving average crossovers perform best in trending markets with 68 to 72% accuracy, while RSI and Bollinger Bands work most effectively in range-bound conditions with 67 to 71% accuracy. Combining one indicator from each category (trend, momentum, volatility) produces the most reliable signals.
How do I analyze forex charts effectively?
Start by identifying the current market phase on a higher timeframe, mark key support and resistance zones, then use price action confirmation and indicator signals near those levels before entering a trade. A structured, multi-timeframe approach consistently outperforms reactive chart reading.
What are the biggest risks in forex technical analysis?
The primary risks include stop-loss slippage during high-volatility events, excessive leverage beyond regulatory limits, and psychological errors like chasing price or moving stops. US regulations cap leverage at 50:1 on major pairs to help manage these risks.
How does session timing affect technical analysis?
Session volatility patterns in forex are highly stable, with the London and New York session overlap consistently producing the highest volatility and most reliable technical setups. Timing entries during peak session hours significantly improves the quality of technical signals.