TL;DR:
- Price action is the direct study of raw price movement on charts, capturing real-time market behavior without lagging indicators. Traders analyze market structure, candlestick patterns, and support/resistance levels to identify high-probability trades based on collective market psychology. Most professional traders combine price action with limited indicators to confirm signals while emphasizing discipline, structure, and scenario planning.
Most traders spend months hunting for the perfect indicator setup, layering RSI on top of MACD on top of Bollinger Bands, only to find themselves more confused than when they started. What is price action? It’s the direct study of raw price movement on a chart, without relying on processed, lagging signals. Price action is a methodology that strips away everything except what the market is actually doing right now. This guide breaks down the core concepts, shows you how it works in real trading scenarios, and clarifies the honest relationship between price action and indicators.
Table of Contents
- Key Takeaways
- What is price action trading
- How price action works in practice
- Price action vs. indicator-based trading
- Building a price action trading plan
- My honest take on price action
- Start trading with the right tools
- FAQ
Key Takeaways
| Point | Details |
|---|---|
| Price action reads raw price | It analyzes pure price movement without lagging indicators to capture real-time market behavior. |
| Market structure comes first | Mapping trends and swing highs/lows before reading candlestick patterns separates high-probability from low-probability trades. |
| Buyer/seller psychology drives price | Every candle reflects the battle between buyers and sellers, revealing intent before indicators can process it. |
| Price action and indicators can coexist | Professionals often use price action for structure and entries, with one or two indicators for confirmation only. |
| Discipline beats tool selection | Execution, risk management, and scenario planning matter more than whether you use price action or indicators exclusively. |
What is price action trading
Price action is a discretionary trading style focused entirely on reading raw price charts. No moving averages. No stochastic oscillators. Just the price itself, its momentum, its patterns, and the levels it repeatedly tests.
Three core components define the price action framework:
- Market structure: The sequence of swing highs and swing lows that tells you what direction price is trending. In an uptrend, price makes higher highs and higher lows. In a downtrend, it makes lower highs and lower lows. A break of that structure is the first warning that conditions are shifting.
- Candlestick patterns: Individual or multi-candle formations that signal intent. The most widely used include the pin bar (a candle with a long rejection wick), the engulfing bar (one candle completely consuming the previous one), and the inside bar (a candle that fits entirely within the previous candle’s range), each reflecting a shift in who is controlling price.
- Support and resistance levels: Horizontal price zones where buyers or sellers have repeatedly stepped in. Research shows up to 80% of reversals occur near these levels, which explains why experienced traders treat them as decision zones rather than just lines on a chart.
Understanding price action means recognizing that these three elements work together. A pin bar on its own tells you very little. A pin bar rejecting a major resistance zone in a downtrend tells you a great deal.
Pro Tip: Before you read any candlestick pattern, ask yourself: where is this pattern forming within the broader trend? A bullish engulfing bar at the bottom of a pullback in an uptrend is a strong signal. The same candle in the middle of a range is noise.
How price action works in practice
Price action represents the collective behavior of every market participant, reflecting all known information in real time. That is why traders who read price action well often sense a shift before any indicator fires.
Here is how the interpretive process unfolds step by step:
- Identify the macro structure. Before looking at any signal, determine whether the market is trending or ranging. A trending market rewards continuation setups. A ranging market rewards reversal plays at the extremes. Getting this wrong sends you in the opposite direction of the highest-probability trades.
- Mark your key levels. Draw horizontal support and resistance at areas where price has clearly reversed before. These become your map. When price approaches them, you shift from passive observation to active analysis.
- Watch for rejection signals. Long upper wicks at resistance tell you sellers pushed price back aggressively. Long lower wicks at support tell you buyers absorbed selling pressure. Bearish signals appear as long upper wicks rejecting price at resistance zones, and this rejection is visible before any indicator catches up.
- Confirm with momentum. Observe whether price is approaching a level with urgency or with decreasing momentum. A series of smaller candles with shrinking ranges into resistance suggests the buyers are losing steam. That is a context clue, not a pattern, and it only comes from reading price directly.
- Define your entry trigger. A specific candlestick signal at a specific level in a specific trend context forms your trade trigger. Trade triggers must be well-defined and adaptable based on unfolding price behavior, meaning you need a plan for what happens if the setup does not materialize as expected.
Pro Tip: Context is everything. A single candlestick pattern viewed in isolation is almost meaningless. The same pattern at the right level, in the right trend, with the right momentum context becomes a high-probability setup. Train yourself to always zoom out before zooming in.
Market psychology sits at the heart of all of this. When you see a sharp rally followed by a sudden reversal into a long upper wick, you are watching panic and uncertainty play out in real time. Sellers overwhelmed buyers at that price. The candle is the evidence. No indicator needed.

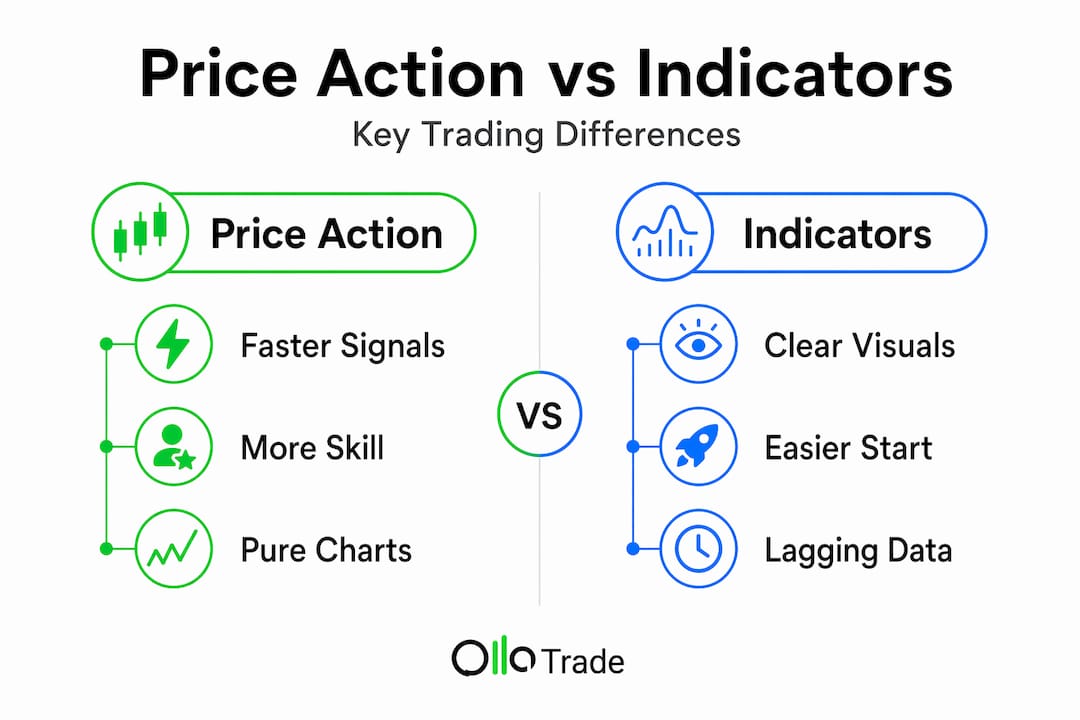
Price action vs. indicator-based trading
This debate runs through every trading forum, every education platform, and every mentorship program. The truth is more nuanced than either side typically admits.
Here is an honest comparison:
| Factor | Price action | Indicator-based |
|---|---|---|
| Signal timing | Earlier, as it reads raw price directly | Lagging, since indicators process past price |
| Skill required | Higher, requires contextual interpretation | Lower barrier to entry for beginners |
| Subjectivity | More subjective, open to different reads | More objective, with defined signal rules |
| Noise filtering | Requires experience to filter low-quality signals | Indicators can filter noise automatically |
| Adaptability | Highly adaptable to changing conditions | Can generate false signals in choppy markets |
Price action provides earlier signals than indicators, but that advantage comes with a cost. It requires more skill and more subjective interpretation. Indicators offer clearer, more defined signals, but those signals are often lagging because they are built from data that has already happened.
What professional traders actually do is use price action to define structure and entry triggers, then use one or two indicators in strictly limited confirmation roles. A 20-period moving average might define the overall trend bias. An RSI reading might confirm whether a level is being approached from an oversold condition. But the actual trade decision comes from the price action signal at the key level.
The debate over price action versus indicators is largely a retail-level distraction. Professionals focus on execution, risk management, and probability rather than tool preference. A trader who executes a mediocre price action setup with excellent risk management will, over time, outperform a trader who uses the most sophisticated indicator system but manages trades poorly.
Building a price action trading plan
Knowing the theory is only half the work. Applying it with discipline requires a structured plan. Here is how to build one around price action principles:
- Define your trend filter first. Before the trading session starts, classify the markets you watch as trending up, trending down, or ranging. For the charting techniques that support this process, focus on higher timeframes like the daily or four-hour chart to establish bias before dropping to lower timeframes for entries.
- Mark levels in advance. Draw your key support and resistance zones before the market moves to them. You want your decision-making done before the pressure of a live move, not during it.
- Define your signal criteria precisely. Specify exactly which candlestick patterns you will act on and at which levels. “A bullish pin bar closing above the midpoint at a tested daily support level in an uptrend” is a signal. “A big green candle” is not.
- Set your stop loss from price structure. Place stops beyond the nearest structural level, not at an arbitrary fixed distance. If you are buying at support, your stop goes below the support zone, where the trade idea is invalidated. This approach is fundamental to managing trading risk effectively over time.
- Plan your scenarios before entry. Price action is adaptive and probability-based, requiring scenario planning rather than prediction. Before entering, decide what happens if the trade moves in your favor and what happens if it moves against you. Both scenarios deserve equal mental preparation.
Pro Tip: Avoid trading every price action signal you identify. The best price action traders are selective. They wait for the confluence of trend direction, key level, and clear candlestick signal before committing. Patience in setup selection separates average traders from consistent ones.
Identifying market structure before trading patterns is not just good advice. It is the dividing line between traders who make price action work and those who dismiss it as too subjective. The patterns are the trigger. Structure is the reason.
My honest take on price action
I’ve worked alongside traders across experience levels, and the pattern I see consistently is this: price action is the one approach that genuinely separates traders who understand markets from those who are just reacting to them.
That said, it is not easy. The subjectivity is real. I’ve seen traders look at the same chart and draw completely different conclusions, both with valid reasoning. That is not a flaw in price action. It is a feature of how markets actually work. There is no single correct read. There is only better-informed and less-informed interpretation.
What I’ve learned is that most traders who fail with price action fail because they skip the structure step. They see a beautiful pin bar and enter immediately, ignoring whether the trend supports the trade or whether the level has any historical significance. Candlestick patterns only carry weight within the larger market structure context, and skipping that step is the single most common mistake I observe.
My advice is to spend 80% of your chart time mapping structure and only 20% looking for entries. The entries will find themselves once the structure is clear. And if you decide to add an indicator or two for confirmation, that is not a compromise. It is how most honest professionals actually trade.
— FX
Start trading with the right tools
Reading about price action is the foundation. Practicing it on live markets, with the right platform and proper risk controls, is where the real skill develops.
Ollatrade gives you direct access to forex markets and CFDs across metals, indices, stocks, energies, and cryptocurrencies, all through a platform built for traders who take chart analysis seriously. The MetaTrader 4 integration means you get professional-grade charting and the flexibility to apply price action analysis techniques without restrictions. If you are building out your approach from the ground up, the forex trading step-by-step guide covers everything from your first trade to active risk management in a format designed for real application. For traders refining existing strategies, Ollatrade’s market news, economic calendars, and research tools keep your analysis grounded in current conditions. Tight spreads and fast execution mean your price action signals translate into trades without unnecessary slippage getting in the way.
FAQ
What is price action in simple terms?
Price action is the analysis of how a market’s price moves over time using only the raw price chart, without lagging indicators. It focuses on patterns, levels, and structure to identify high-probability trade setups.
How does price action work in trading?
Price action works by mapping market structure, identifying key support and resistance levels, and reading candlestick patterns that reveal buyer and seller intent. Traders use these signals to time entries and exits with defined risk.
Is price action better than using indicators?
Neither is universally superior. Price action delivers earlier signals but requires more skill, while indicators offer clearer rules but lag behind the market. Most professional traders use a combination of both.
What are the most important price action strategies?
The most reliable strategies involve trend continuation setups, such as pullbacks to support in an uptrend, and reversal setups at key levels confirmed by rejection candlesticks like pin bars or engulfing bars within clear trend contexts.
What influences price action in financial markets?
Price action is shaped by the collective decisions of all market participants, including institutional orders, retail sentiment, macroeconomic data releases, and liquidity dynamics. Every candlestick on your chart is the result of real orders being placed and filled in real time.