TL;DR:
- Most traders rely on gut feelings and random chart browsing, which can lead to inconsistent results and blown accounts.
- Using structured research tools and high-quality data transforms subjective analysis into objective, reliable decision-making.
- Consistency in sourcing, validating, and logging trades builds a disciplined process that provides a sustainable trading edge over time.
Most traders have done it. You scan a few charts, get a feeling, and pull the trigger on a trade. It feels intuitive, even exciting. But gut-based trading and random browsing are the leading culprits behind blown accounts and inconsistent performance. Understanding why use research tools is not an academic exercise. It is the difference between building a repeatable edge and gambling with a strategy you cannot replicate. Research can identify trends, assess risks, validate strategies, and reduce guesswork so your outcomes are informed, not accidental. This guide shows you exactly how.
Table of Contents
- How research tools improve trading decisions
- The critical role of data quality in research tools
- Structured idea sourcing: from random browsing to reliable opportunity flow
- Putting research tools to practical use in trading workflows
- Why most traders underestimate research tools: the hidden edge you can’t afford to ignore
- Enhance your trading with Olla Trade’s research tools and resources
- Frequently asked questions
Key Takeaways
| Point | Details |
|---|---|
| Objective decision-making | Research tools help replace guesswork with data-driven trading decisions based on facts and validation. |
| Data quality matters | High-quality historical data is essential for accurate backtests and reliable strategy assessment. |
| Structured sourcing | Using systematic idea sourcing methods improves trade setup quality and reduces cognitive biases. |
| Discipline unlocks edge | Consistent use of research tools and workflows leads to better, more repeatable trading results. |
| Platform support | Trading platforms with integrated research tools streamline analysis, backtesting, and risk management. |
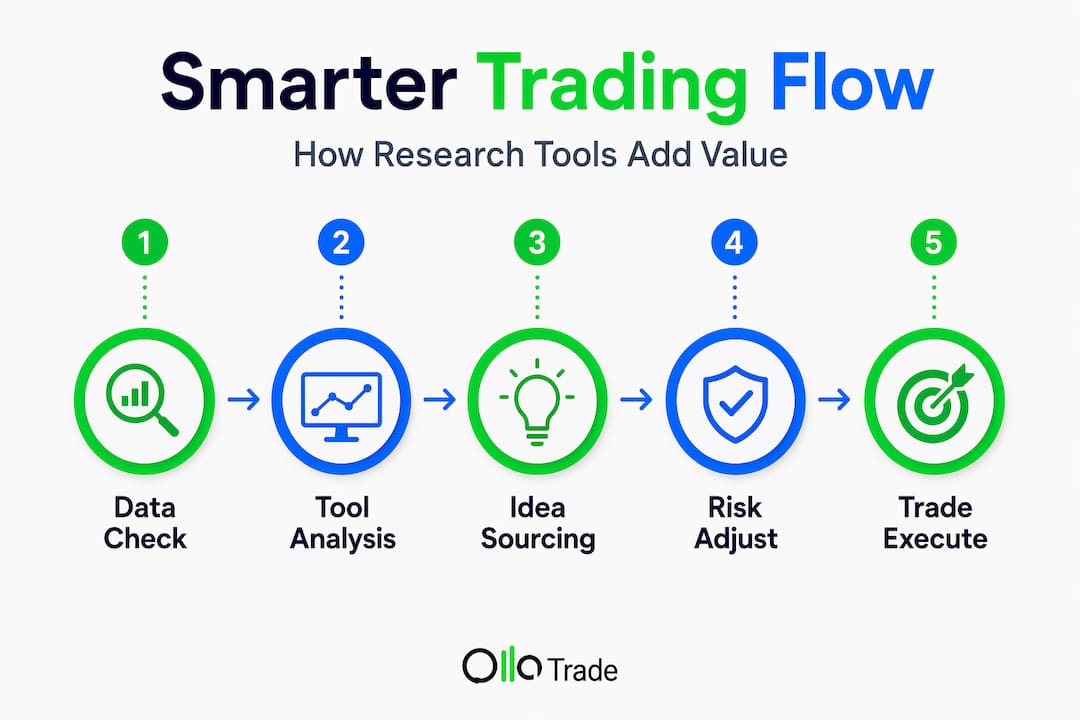
How research tools improve trading decisions
The most dangerous belief in trading is that skill means “reading the market” by instinct. It does not. Skilled traders build systems that replace emotional judgment with structured analysis, and that is precisely where research tools earn their place.
Research tools transform subjective judgment into objective analysis. When you look at a chart and “feel” a breakout coming, you are processing a limited slice of information filtered through your own biases. A research tool, by contrast, processes hundreds of variables simultaneously. Price history, volume patterns, correlation data, volatility regimes. Things your eye simply cannot track at scale.
Here is what structured, tool-based research actually does for your trading:
- Trend identification: Pinpoints momentum shifts before they become obvious to the crowd
- Risk assessment: Quantifies downside exposure so you size positions appropriately
- Strategy validation: Tests your logic against real historical data before you risk capital
- Bias reduction: Removes emotional anchoring by making decisions from data, not feelings
- Efficiency: Scans hundreds of instruments in seconds rather than hours
The effectiveness of research tools compounds when you integrate them into a repeatable workflow. A trader using advanced charting tools alongside a structured screening process is not just faster. They are more accurate, because the data reveals patterns that gut instinct consistently misses.
Pro Tip: Start with one research tool you will actually use every session. Consistency with a single tool beats sporadic use of five.
The best trading tools for forex and crypto are not valuable because they are complicated. They are valuable because they impose discipline on a process that, left to human impulse, defaults to chaos.
The critical role of data quality in research tools
Understanding the benefits of research tools is step one. Step two is recognizing that a tool is only as good as the data feeding it. This is where many traders quietly undermine their own research without realizing it.

Here is a fact that should stop you cold: identical strategy logic can produce materially different backtest outcomes depending on the historical data provider you use. The same entry and exit rules, run on two different data feeds, can show one strategy as profitable and the other as a loser. That is not a minor discrepancy. That is a structural flaw in your research process.
Why does this happen? A few key reasons:
- Timestamp mismatches: When bar open/close times are recorded inconsistently across providers, entries and exits shift
- Missing data gaps: Periods of illiquidity or feed outages create phantom volatility in backtests
- Survivorship bias: Some datasets only include instruments that still exist, inflating historical performance
- Dividend and split adjustments: Incorrect handling of corporate events distorts equity price history
“Treat historical data as infrastructure, not a disposable commodity. The same rigor you apply to your strategy logic must apply to the data that tests it.”
The importance of research tools only materializes when you treat data validation as a non-negotiable step. Before you backtest any strategy, verify your data source. Check for gaps. Confirm timestamp accuracy. Audit for obvious price spikes that represent feed errors rather than real market moves.
The key features of trading platforms worth paying attention to include built-in data quality indicators and the ability to cross-reference feeds. Platforms that let you validate data before committing to a backtest save you from optimizing strategies around artifacts that will never repeat in live markets.
Pro Tip: Run the same backtest on two different data providers. If results diverge significantly, your strategy may be optimizing on data noise rather than genuine market behavior.
Structured idea sourcing: from random browsing to reliable opportunity flow
With research tools and data quality in focus, there is a third piece most traders completely overlook: where your trade ideas come from in the first place. This is the upstream problem. Fix it, and everything downstream gets easier.
Random chart browsing is the default sourcing method for most retail traders. You open your platform, scroll through instruments, and something catches your eye. The problem is this process is riddled with recency bias, pattern-seeking bias, and selection bias. You find what you are subconsciously looking for, not necessarily what the market is actually offering.
Structured sourcing reduces recency bias and converts chaotic research into a more reliable opportunity flow over 60 to 90 days of consistent application.
There are three main structured sourcing methods:
- Watchlist-based sourcing: You maintain a fixed list of instruments that match your strategy criteria. Each session, you check only those instruments for setups. No browsing, no impulse picks.
- Scanner-based sourcing: You define quantitative criteria (specific ATR levels, volume thresholds, price pattern criteria) and let the scanner surface candidates automatically.
- News-driven sourcing: You align trade ideas with scheduled economic events or material news, using an economic calendar as your filter for which instruments to research that session.
Here is how the three methods compare across key dimensions:
| Method | Bias control | Setup frequency | Time required | Best for |
|---|---|---|---|---|
| Watchlist-based | High | Low to medium | Low | Swing traders, position traders |
| Scanner-based | High | High | Medium | Day traders, breakout strategies |
| News-driven | Medium | Event-dependent | Medium | Macro traders, volatility players |
The critical step most traders skip is committing to one primary sourcing method for a full 60 to 90 days. This builds a trackable pipeline. You can then measure your idea-to-trade ratio, your trade-to-winner ratio, and diagnose whether your problem is poor sourcing or poor execution. Without structure, you cannot separate the two.
Essential trading strategies map cleanly onto specific sourcing methods. A mean-reversion strategy pairs naturally with scanner-based sourcing. A news-driven strategy pairs with macro event monitoring. Misaligning your sourcing method with your strategy type is like fishing with the wrong bait.
Pro Tip: Track your pipeline ratios. If you source 20 ideas and only 2 become trades, your filter criteria may be too loose. If 18 out of 20 become trades but results are poor, your execution process needs attention.
Market news for trading decisions plays a key role in news-driven sourcing, but the data analysis tools you pair with it determine whether you act on genuine signals or noise.
Putting research tools to practical use in trading workflows
Knowing why to use research tools and understanding their components is valuable. Turning that knowledge into a daily habit is where traders separate themselves.
Here is a practical daily workflow that embeds research tools into your process:
- Pre-session: Run your scanner or review your watchlist. Flag candidates that meet your criteria. Do not browse randomly.
- Setup evaluation: For each flagged candidate, consult your research tool for supporting data: trend direction, volatility context, key support and resistance levels.
- Backtest check: If a setup type is new or low-frequency, run a quick backtest on validated data before sizing up.
- Trade execution: Execute only setups that pass your research criteria. Log every trade with the sourcing method and data points that supported it.
- Post-session review: Compare outcomes to your pre-trade research. Were the data points accurate? Did the setup behave as historical data suggested?
The table below shows how research tool integration affects key trading metrics based on structured versus unstructured approaches:
| Metric | Unstructured approach | Structured, tool-assisted approach |
|---|---|---|
| Trade idea quality | Variable, often low | Consistently filtered |
| Backtest reliability | Subject to data errors | Validated, audited |
| Strategy win rate | Inconsistent | Measurable and improvable |
| Risk per trade | Often arbitrary | Data-informed position sizing |
| Workflow repeatability | Low | High |
Integrating risk management insights from your research data directly into position sizing is one of the highest-leverage changes you can make. When research tells you volatility is elevated, your position size should reflect that. Most traders ignore this connection entirely.
The path to maximizing trading profits is not finding better setups. It is building a better process. Research tools are the infrastructure that makes that process reliable.
Why most traders underestimate research tools: the hidden edge you can’t afford to ignore
Here is a truth worth sitting with. Most traders know research tools exist. Many have access to them. Very few use them with any consistency. That gap is not about education. It is about psychology.
Random browsing feels like research. Scrolling charts, reading headlines, following trading accounts on social media. It all creates the sensation of gathering information. But most retail traders skip sourcing discipline because random browsing feels more engaging than structured workflows, and that preference perpetuates poor sourcing indefinitely.
Structured research is frankly less exciting. Running a scanner on defined criteria is repetitive. Validating data before a backtest is tedious. Logging pipeline ratios at the end of a session is not glamorous. But these are exactly the behaviors that separate traders who grind consistent profits from those who have great weeks followed by catastrophic ones.
The research tools for decision making conversation in trading almost always focuses on what tools to use. The harder, more important question is: why do so many traders have the tools and still not use them properly? The answer is that discipline does not come from motivation. It comes from systems. When you build a sourcing, validation, and logging system, discipline is the output of the system, not a personal quality you have to manufacture from scratch each morning.
There is also a competitive angle that gets underplayed. If the majority of retail traders are sourcing ideas through random browsing and skipping data validation, then traders who adopt even basic structured research workflows have a genuine edge. Not from superior intellect. From superior process.
The best trading tools available to you right now are not the problem. The question is whether you are willing to trade the adrenaline of random browsing for the quieter, compounding rewards of systematic research. The traders who answer yes consistently are the ones still trading profitably five years from now.
Enhance your trading with Olla Trade’s research tools and resources
The framework in this article is only as good as the platform you apply it on.
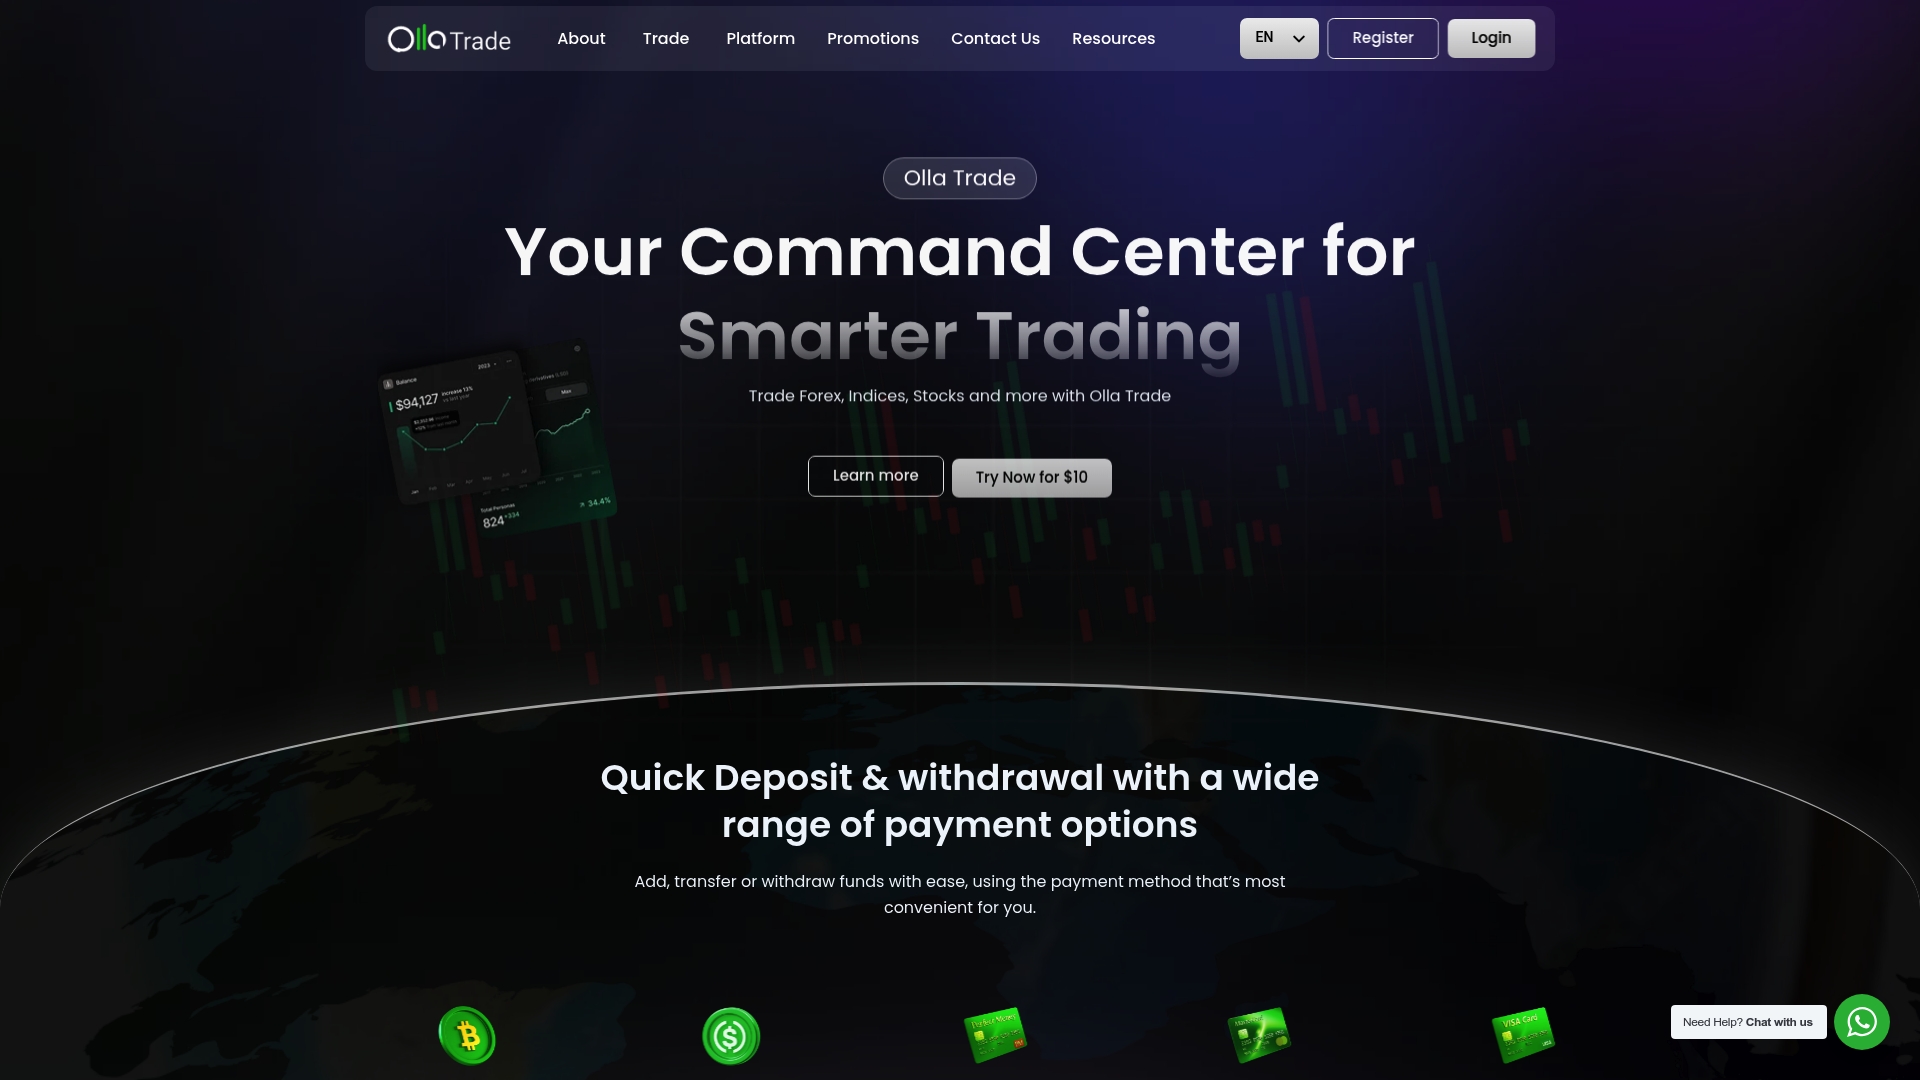
Olla Trade gives you the infrastructure to put structured research into practice. Access platform features built for traders who take analysis seriously, including charting, scanning, and data tools designed to support every step of the workflow covered here. Explore the full suite of trading tools for forex, CFDs, and crypto available across Olla Trade’s platform. Whether you trade forex, metals, indices, or digital assets, the tools and educational resources are there to help you build a process that compounds over time. Start with the platform, commit to the process, and let the data do the work.
Frequently asked questions
What are research tools in trading and why are they important?
Research tools in trading are software and data systems that provide objective market analysis. They help traders identify trends, validate strategies, and reduce guesswork for more informed, consistent decisions.
How does data quality affect backtesting results?
Data quality directly shapes backtesting accuracy. Identical strategy logic can yield materially different outcomes depending on the data provider, meaning poor data can fool you into trusting a strategy that will fail in live markets.
What is structured idea sourcing and how does it improve trading?
Structured idea sourcing replaces random browsing with systematic methods like watchlists or scanners to find trade setups. Structured sourcing reduces recency bias and builds a more reliable, trackable opportunity flow over time.
Can ignoring research tools impact trading performance?
Yes, significantly. Without research tools, traders default to intuition and emotional decision-making. Random browsing perpetuates poor sourcing habits that consistently lower trade quality and inflate losses over time.
How can I integrate research tools effectively into my trading routine?
Adopt one structured sourcing method, validate your data before backtesting, log every trade and its supporting data points, track pipeline ratios, and review outcomes after each session to iteratively improve your process.