TL;DR:
- Charting tools visualize price data to identify trends, support, and resistance levels for better decision making.
- Advanced platforms integrate AI, backtesting, and multi-timeframe analysis to enhance trading precision.
- Standalone technical analysis has limited predictive power; combining it with risk management and fundamentals improves results.
Advanced charting tools: boost your trading analysis
Most traders load up their charts, fire off trades, and wonder why the results keep disappointing. The hard truth is that day trading loss rates exceed 80 to 90% even among traders who actively use charting software. The problem is rarely the tool itself. It’s how traders understand and apply it. This guide covers the mechanics of charting tools, the platforms pushing boundaries with AI and backtesting, the empirical evidence on what actually works, and the practical strategies that help you use charts as precision instruments rather than crystal balls.
Table of Contents
- Core functions of charting tools in trading
- Advanced charting methodologies: From AI to multi-timeframe confluence
- Empirical evidence: Performance, limitations, and risk
- Practical strategies: Using charting tools for risk management and timing
- Why charting tools are misunderstood and where they truly add value
- Explore advanced platforms for trading success
- Frequently asked questions
Key Takeaways
| Point | Details |
|---|---|
| Visualizing market structure | Charting tools help traders see price patterns, trends, and psychological turning points clearly. |
| Advanced features unlock edge | Alerts, AI, and backtesting add sophistication, improving analysis and decision making. |
| Empirical evidence guides strategies | Research shows daily charts and ML enhancements outperform many traditional methods. |
| Risk management is essential | Charting works best as a risk filter and timing aid rather than a pure prediction tool. |
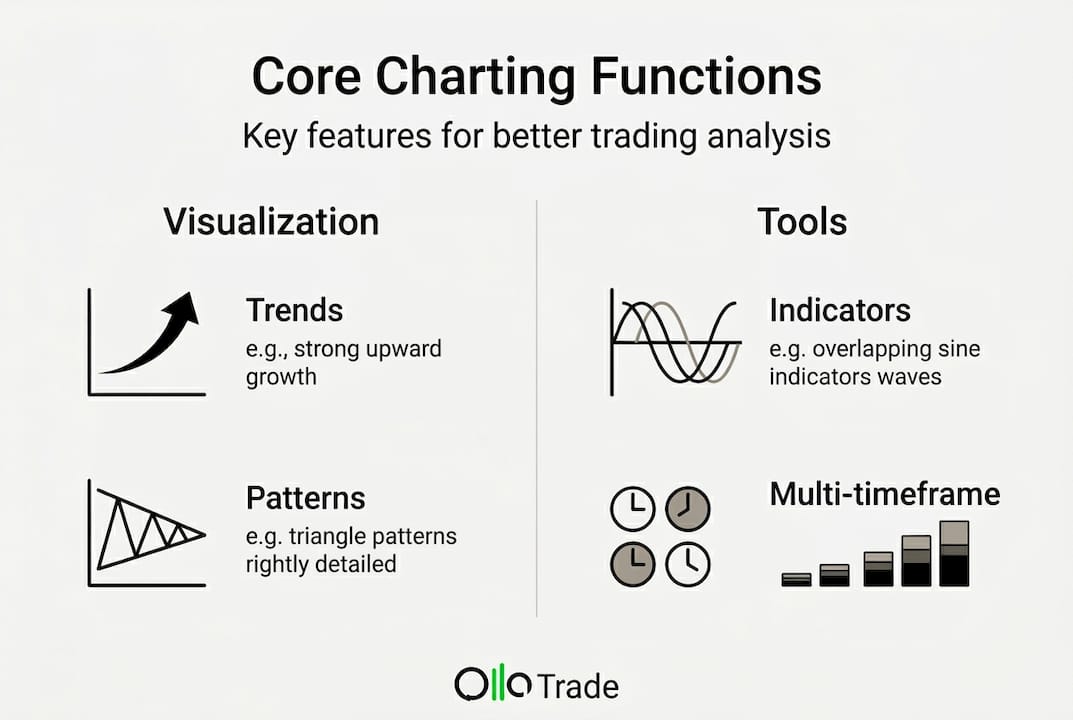
Core functions of charting tools in trading
Charting tools are the foundation of technical analysis. Before you can evaluate advanced platforms or multi-timeframe strategies, you need a clear picture of what these tools actually do at the core level.
At the most basic level, charting tools visualize price movements, volume, and patterns across financial instruments. They turn raw price data into readable structures that help you identify trends, reversals, and key decision zones. Without this visualization layer, you’re trading blind.
Here are the primary types of charts you’ll work with:
- Candlestick charts: The most widely used format. Each candle shows the open, high, low, and close for a given time period. Color coding makes bullish and bearish sessions easy to spot at a glance.
- Bar charts: Similar to candlesticks but displayed as vertical bars with small horizontal tick marks. Preferred by some professional traders for their cleaner visual presentation.
- Line charts: Connect closing prices over time. Less detail, but excellent for identifying macro trends without distraction.
- Area charts: A shaded version of the line chart. Useful for comparing asset performance across longer time windows.
Beyond chart types, mechanics like multi-timeframe analysis and drawing tools are where the real work happens. Drawing tools allow you to map structure directly onto price action:
- Trendlines identify the dominant direction of price and flag potential breakouts or reversals.
- Fibonacci retracements mark levels where price commonly pauses or reverses after a significant move.
- Price channels frame price between parallel support and resistance lines, giving you defined zones for entries and exits.
- Horizontal support and resistance levels highlight historical reaction zones where buyers and sellers have repeatedly clashed.
Technical indicators add another analytical dimension. The RSI (Relative Strength Index) measures momentum and flags overbought or oversold conditions. The MACD (Moving Average Convergence Divergence) signals trend shifts by comparing two exponential moving averages. Simple and exponential moving averages smooth out price noise and help you confirm trend direction.
“Technical analysis through charting is not about prediction. It’s about reading market psychology and structuring risk around high-probability scenarios.”
Multi-timeframe functionality deserves special attention. Viewing the same instrument on a daily chart alongside a 15-minute chart gives you the macro context and the micro precision in one workflow. This dual perspective is one of the most underused features in retail trading.
You can explore charting techniques and get a broader view of the available trading tools that support this kind of layered analysis. Volume data, open interest on futures, and volatility overlays round out the core feature set that every serious trader should understand before moving to advanced platforms.
Advanced charting methodologies: From AI to multi-timeframe confluence
Now that we’ve covered the basic functions, let’s look at how advanced methodologies and platforms push possibilities even further.
Advanced charting platforms combine alerts, AI-powered analysis, backtesting engines, and multi-timeframe confluence into one cohesive workflow. This is where amateur analysis separates from professional-grade decision making.

Here’s how the leading platforms stack up:
| Platform | Key strengths | Best for |
|---|---|---|
| TradingView | Massive indicator library, social trading, alerts | Retail and semi-pro traders |
| TrendSpider | AI pattern detection, multi-timeframe raindrop charts | Technical purists |
| thinkorswim | Integrated brokerage, scripting, options tools | Active US traders |
| MetaTrader 4 | EA automation, custom indicators, fast execution | Forex and CFD traders |
Platforms like TradingView and TrendSpider support hundreds of built-in indicators alongside custom scripting languages, giving you the flexibility to design and test unique setups. TrendSpider’s automated trendline detection removes the subjective human bias that causes most traders to draw lines where they want to see them rather than where price actually respects them.
AI-assisted screeners represent a significant leap forward. Instead of manually scanning hundreds of instruments, you set parameters and the algorithm surfaces setups that match your criteria. This compresses hours of analysis into minutes and removes emotional filtering from the screening process.
Key advanced features to prioritize:
- Backtesting engines: Test your strategy across historical data before risking real capital. Look for platforms that account for slippage and spreads in their results.
- Multi-timeframe alerts: Get notified when a daily level is being tested on a 1-hour chart simultaneously. Confluence alerts are one of the highest-value automation features available.
- Fundamental data overlays: Overlay earnings dates, economic releases, or Fed meeting dates directly onto your price chart. This integration prevents you from being blindsided by fundamental catalysts.
- Pattern recognition tools: Automated detection of head and shoulders, wedges, triangles, and flag formations removes the guesswork.
Pro Tip: Use AI-assisted screeners as your first filter, not your final decision. Let the algorithm narrow the universe, then apply your own multi-timeframe confluence analysis to the candidates it surfaces. This hybrid approach reduces bias while preserving your analytical edge.
Explore pattern recognition tools that work alongside these platforms, and review platform features that support a professional-grade workflow. If you want to understand the broader implications of AI in trading, the technology is evolving faster than most retail traders realize.
Empirical evidence: Performance, limitations, and risk
Having explored feature-rich platforms, let’s evaluate if these advanced tools actually translate into improved trading outcomes.
The research here is sobering. Daily timeframes outperform hourly in systematic backtests, with daily strategies showing 57.4% profitable outcomes compared to 45.6% for hourly strategies. That gap matters enormously when you’re compounding results over months and years.
| Timeframe | Profitable strategies | Key risk factor |
|---|---|---|
| Daily (D1) | 57.4% | Overnight exposure, wider stops |
| Hourly (H1) | 45.6% | Noise, spread costs, execution slippage |
But even with a 57% edge at the strategy level, empirical studies show that most retail day traders still lose money. Candlestick patterns, on their own, lack statistically significant predictive power even when trend filters are applied. The 80 to 90% loss rate persists across markets, geographies, and experience levels.
Where do charting tools actually work versus where do they fail?
- Trending markets: Charts shine here. Moving average crossovers, breakouts, and momentum indicators perform well when price is making consistent directional moves. The structure is clean and signals are more reliable.
- Choppy or ranging markets: This is where most traders blow up. Indicators whipsaw, false breakouts spike stop losses, and the signal-to-noise ratio collapses. Charting tools are not designed to predict when trending conditions will resume.
- News-driven spikes: No chart pattern accounts for a surprise central bank decision or geopolitical event. Fundamental catalysts regularly invalidate technical setups instantly.
Common pitfalls traders fall into:
- Overfitting in backtests: Tuning indicators to fit historical data creates strategies that look incredible in testing and fail in live markets.
- Repainting indicators: Some popular indicators recalculate past values as new price data arrives, making historical performance look better than it actually was.
- Ignoring transaction costs: A strategy with a 55% win rate can still be unprofitable after spreads, commissions, and swap fees are factored in.
- Survivorship bias: The strategies you see shared online are the ones that worked. The thousands that failed are invisible.
“The biggest mistake is treating a chart pattern as a trade signal rather than a context tool. The chart tells you where you are. It doesn’t tell you where price will go.”
Check out pattern success rates backed by data, the essential patterns cheat sheet for faster recognition, and market news updates that add fundamental context to your technical setups.
Practical strategies: Using charting tools for risk management and timing
With data-driven evidence on what works and what doesn’t, here’s how to apply charting tools effectively in real market situations.
Using charts as a risk filter rather than a signal generator is the single most important mental shift you can make. Here’s a practical framework:
-
Start with the daily chart to define context. Identify the dominant trend direction, key support and resistance levels, and any patterns forming on the higher timeframe. This becomes your trading bias for the session. If the daily chart shows a downtrend, you should only be looking for short entries, not longs.
-
Drop to the 4-hour or 1-hour chart for structure. Look for price compressing into a key daily level. Consolidation near support in an uptrend or near resistance in a downtrend signals that a potential move is building. This is confluence: multiple timeframes agreeing on the same zone.
-
Use the 15-minute or 5-minute chart for entry precision. Wait for a trigger pattern. A pin bar, inside bar, or engulfing candle at a key level on the lower timeframe gives you a precise entry point with a clearly defined stop loss. Your stop goes just beyond the structure, not at an arbitrary distance.
-
Calculate your risk before entry, not after. Measure the distance from your entry to your stop. Make sure the resulting position size keeps your risk below 1 to 2% of your total account on any single trade. Charting tools help you see these levels visually, but risk sizing is a mathematical discipline.
-
Integrate fundamental context. Before entering, check the economic calendar for scheduled events. A technically perfect setup becomes high risk if there’s a central bank announcement scheduled in two hours. Use multi-device and timeframe analysis to stay connected to your positions and alerts across sessions.
-
Review and log every trade. The most valuable charting data you have is your own trade history. Reviewing your entries and exits against the chart context helps you identify patterns in your own decision making, not just in price.
Pro Tip: ML-enhanced technical analysis has demonstrated positive annualized excess returns over buy-and-hold strategies when transaction costs are kept low. If you’re developing systematic strategies, incorporating machine learning for signal filtering and position sizing can provide a measurable edge that pure discretionary charting cannot reliably replicate.
The best trading software for professional-grade risk management integrates these charting functions with built-in risk calculators and multi-instrument monitoring, so your workflow stays efficient even when managing multiple open positions simultaneously.
Why charting tools are misunderstood and where they truly add value
Here’s an uncomfortable truth most trading educators won’t say directly: charting tools are not forecasting instruments. They are visualization and risk management instruments. That distinction changes everything about how you use them.
Traders fail not because their charts are wrong but because they approach charts expecting answers rather than context. Charting tools are essential for reading market psychology, mapping the emotional footprint of buyers and sellers across time. But empirical evidence consistently questions whether standalone technical analysis produces profitable outcomes at scale.
The traders who extract real value from charts use them to do three specific things: structure their risk, time their entries relative to key levels, and maintain discipline by having predefined zones that invalidate their trade thesis. The chart tells them when they’re wrong quickly and cheaply.
Combining charting with fundamentals, multiple timeframes, and AI-assisted analysis is what separates consistently profitable operators from the 80 to 90% who lose. The chart is one input, not the entire decision. Treat it that way and you’ll stop looking for the perfect indicator and start building a decision-making process that manages risk systematically across varying market conditions.
Explore advanced platforms for trading success
You now have a clear framework: understand what charting tools actually do, use advanced platforms to extend your analytical capabilities, respect the empirical limitations of standalone technical analysis, and apply charts primarily as risk management and timing instruments.
The next logical step is putting the right platform infrastructure in place. Our trading platforms guide walks you through everything you need to evaluate and choose a platform that matches your trading style, instrument mix, and workflow. To go deeper on specific features that separate good platforms from great ones, the guide to platform features covers the details that most traders overlook until it costs them. Start with the right setup and the tools will work the way they’re supposed to.
Frequently asked questions
Are charting tools alone enough to make profitable trading decisions?
No. Candlestick patterns lack predictive power on their own, and day trading loss rates exceed 80%, which confirms that charts must be combined with sound risk management and fundamental context to be effective.
Which timeframe is best for chart analysis: hourly or daily?
Daily timeframes outperform hourly in backtests, producing 57.4% profitable strategies versus 45.6% for hourly, making the daily chart the more reliable anchor for building trade setups.
Can AI and machine learning improve trading performance with charting tools?
Yes. ML-enhanced analysis beats buy-and-hold strategies with positive annualized excess returns, particularly when transaction costs are kept low, making it a meaningful addition to a charting-based workflow.
What are some common pitfalls when using charting tools?
High costs, slippage, intraday noise, and overfitting in backtests are the most damaging pitfalls, often turning a theoretically profitable strategy into a losing one in live market conditions.