
TL;DR:
- Most traders ruin their accounts not by choosing poor trades but by neglecting effective risk management strategies.
- Implementing concrete controls like position sizing formulas and drawdown caps helps traders survive long enough to develop skill.
- Treating correlated positions as a single risk and adhering to behavioral discipline prevent self-destructive losses and promote sustainable growth.
Most traders blow up their accounts not because they pick bad trades, but because they never build a real risk management strategies guide to live by. One bad streak without hard limits can wipe out months of gains in days. This guide gives you concrete, numeric controls: position sizing formulas, drawdown caps, correlation traps to avoid, and the behavioral rules that separate traders who survive long enough to get good from those who quit in frustration. Every strategy here is practical, testable, and built for real market conditions.
Table of Contents
- Key takeaways
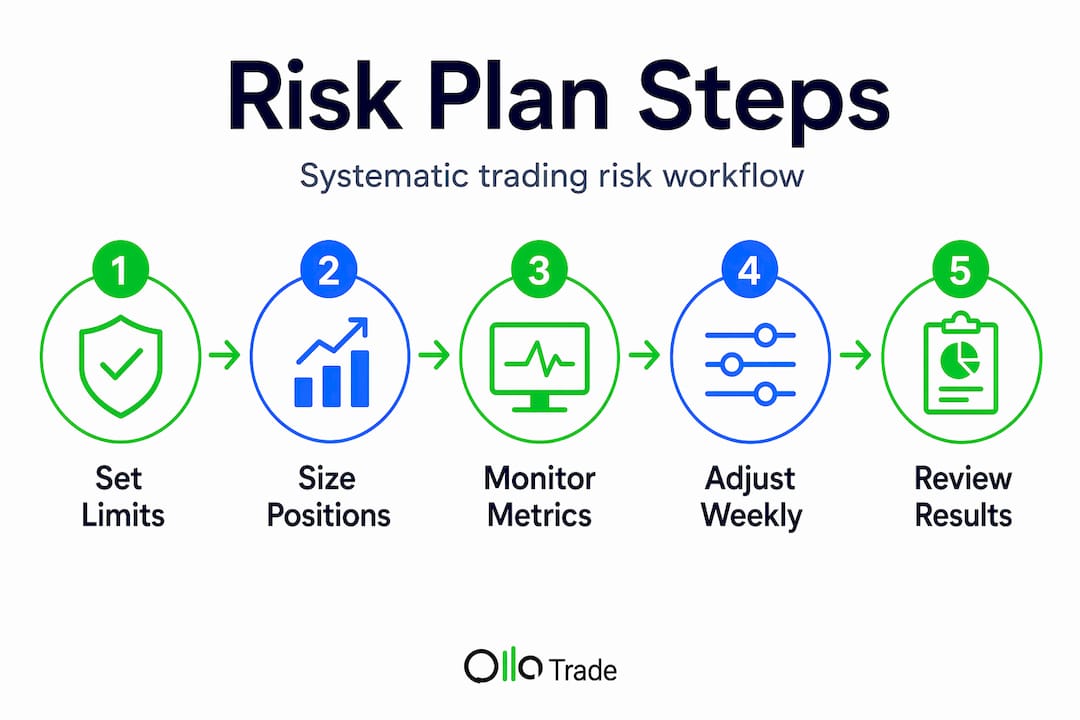
- Your risk management strategies guide: foundations first
- Executing position sizing and risk limits
- Managing portfolio-level risk: correlation and leverage
- Behavioral rules that prevent self-destruction
- Monitoring performance and refining your plan
- My honest take on risk management
- Put your risk plan into practice with Ollatrade
- FAQ
Key takeaways
| Point | Details |
|---|---|
| Size positions by volatility | Use ATR to adjust position size dynamically and keep monetary risk consistent across instruments. |
| Cap losses at every level | Risk 0.25%–1% per trade, stop the day at 2%–3% loss, and halt the week at 4%–6%. |
| Treat correlated positions as one | Highly correlated instruments multiply your true exposure, often invisibly. |
| Stop and journal after daily limits | Hitting your daily stop means session over, not time to recover losses. |
| Review metrics monthly | Track drawdown, expectancy, and stop adherence to catch problems before they compound. |
Your risk management strategies guide: foundations first
Before you apply any tactic, you need two numbers written down: the maximum account drawdown you can tolerate before you stop trading entirely, and the maximum percentage you will risk on any single trade. Without those two anchors, every other rule collapses under pressure.
Start by reviewing your risk appetite framework before placing another trade. A drawdown tolerance of 20% means that if your account drops 20% from peak, you pause and review your entire plan. This is not a soft guideline. It is a hard circuit breaker.
The core tools you need:
- Average True Range (ATR): Measures how much an instrument moves on average per session. Use it to set stop distances that respect actual market behavior, not round numbers.
- Correlation matrix: A table showing how your open positions move relative to each other. You can build one in Excel or use a broker platform with built-in analytics.
- Trading journal: Record every trade with entry, stop, target, position size, and the reasoning behind the trade. Without a journal, you are flying blind during reviews.
- Risk calculator: A simple spreadsheet that converts your account balance and risk percentage into a concrete dollar amount and then into a position size based on your stop distance.
Pro Tip: Set your maximum drawdown tolerance before you fund an account, not during a losing streak. Decisions made under pressure are almost always wrong.
Here is a quick reference for baseline defaults when you are starting out:
| Parameter | Conservative | Moderate | Aggressive |
|---|---|---|---|
| Risk per trade | 0.25%–0.5% | 0.5%–1% | 1%–2% |
| Daily loss cap | 2% | 2%–3% | 3%–4% |
| Weekly loss cap | 4% | 4%–6% | 6%–8% |
| Max open positions | 2–3 | 4–5 | 6+ |
These defaults exist because traders with daily loss limits of 2%–3% show 34% lower maximum drawdowns than those trading without them.
Executing position sizing and risk limits
This is where most traders either get disciplined or get destroyed. Position sizing is not about how confident you feel in a trade. It is a math problem with one goal: survive long enough to let your edge play out.
Here is the step-by-step process for sizing every trade:
- Calculate your dollar risk. Multiply your account balance by your chosen risk percentage. On a $10,000 account risking 0.5%, that is $50 per trade.
- Set your stop distance using ATR. If the daily ATR on EUR/USD is 70 pips, a 1x ATR stop is 70 pips. Using a tighter stop than ATR invites random noise to stop you out.
- Compute position size. Divide your dollar risk by the risk per unit at your stop distance. If each pip is worth $1 and your stop is 70 pips, position size equals $50 divided by $70, which gives you 0.71 mini lots.
- Apply your daily and weekly caps. Before entering, check whether this trade could push you past your daily loss limit if stopped out. If your daily cap is 2% ($200) and you have already lost $150 today, your remaining risk budget is $50.
- Scale down during drawdowns. If you are in a 5% drawdown on the month, cut your per-trade risk by half until you recover to breakeven. Drawdown-based position adjustments like this protect you from compounding losses during bad stretches.
Pro Tip: Never measure your stop distance in round numbers like “50 pips.” Measure it as a multiple of ATR. The market does not care about your round numbers.
Volatility-based position sizing adjusts your trade size dynamically so that a volatile instrument like crude oil does not accidentally carry three times the risk of a quieter pair like EUR/CHF. The formula is the same regardless of what you trade. Only the ATR value changes.

The multi-layered risk playbook of trading 0.25%–1% per trade, capping daily losses at 2%–3%, and stopping weekly at 4%–6% forms the backbone of effective risk mitigation for accounts of any size.
Managing portfolio-level risk: correlation and leverage
Single-trade risk rules are necessary but not sufficient. Where most traders get hurt at the portfolio level is through two invisible multipliers: correlation and leverage.
Correlation risk means that holding three positions that all move together is functionally equivalent to holding one large position. If you are long EUR/USD, long GBP/USD, and short USD/JPY simultaneously, you are essentially making one big bet that the US dollar weakens. Correlated positions during volatility events can approach a correlation of 1.0, meaning all three move almost identically. Your effective risk is not 0.5% times three. It is closer to 1.5% on a single theme.
The practical rule: treat any group of instruments with a correlation above 0.7 as a single position for sizing purposes. If you want to hold multiple correlated trades, the combined position size should not exceed your normal single-trade risk limit.
Leverage is where comprehensive risk management gets real. Most retail traders focus on entry and exit but ignore that their leverage setting determines how quickly drawdowns can become irreversible. Leverage scales volatility linearly but the probability of catastrophic drawdown grows nonlinearly as leverage increases. Going from 10x to 20x leverage does not double your risk of blowing up. It can quadruple it or worse depending on the asset’s volatility profile. Review a thorough breakdown of leverage and margin risks before adjusting your account settings.
Key portfolio-level rules to apply:
- Cap total exposure to any single currency, sector, or asset class at 5%–10% of account equity.
- Before major macro events like Federal Reserve decisions or CPI releases, reduce position sizes by 30%–50% to account for volatility spikes.
- Never use maximum available leverage. Treat your broker’s leverage limit as a theoretical ceiling, not a target.
- Review open position correlations before adding any new trade, not after.
Correlation risk is the reason some traders feel diversified while actually carrying enormous concentrated exposure. ERM frameworks that integrate correlation monitoring into daily operations consistently outperform those that treat each position in isolation.
Behavioral rules that prevent self-destruction
Numbers alone do not protect you. Behavioral rules do. The most dangerous moment in trading is not when the market moves against you. It is the five minutes after you hit your daily stop and convince yourself that one more trade will fix it.
A practical behavioral framework looks like this:
- Immediate halt protocol. The second you hit your daily loss limit, close all open trades and end the session. Log the date, the total loss, and the emotional state you were in. Do not skip the journal entry.
- Pre-trade checklist. Before entering any position, verify your entry, stop, and position size in writing. Confirm that the trade does not push your daily or weekly exposure past your limits. Confirm that it does not create excessive correlation with existing positions.
- Timed breaks after consecutive losses. A 30-minute pause after two consecutive losses is one of the most underrated risk controls in trading. It disrupts the emotional momentum that leads to revenge trading.
- Emotional state scaling. If you are angry, tired, or distracted, cut your position size by half or sit out entirely. The market will be there tomorrow.
“The goal of risk management is not to avoid losses. It is to keep losses small enough that you can continue trading when conditions improve.”
Pro Tip: Keep a one-sentence “emotional audit” at the top of each trading session log. Write how you actually feel before you start. Patterns will emerge over weeks that reveal when you trade worst.
Risk management is a continuously embedded discipline, not something you set up once and forget. The traders who last are the ones who treat behavioral rules with the same seriousness as position sizing math.
Monitoring performance and refining your plan
Applying your rules is step one. Measuring whether they are actually working is step two, and most traders skip it entirely. You need a short list of metrics tracked consistently, not occasionally.
| Metric | What it tells you | Review frequency |
|---|---|---|
| Maximum drawdown | How far your account has fallen from peak | Weekly |
| Expectancy | Average profit per trade after wins and losses | Monthly |
| Win rate | Percentage of trades closed profitably | Monthly |
| Stop adherence | How often you respected your planned stop | Weekly |
| Risk:reward ratio | Average winner size versus average loser size | Monthly |
When any metric degrades over two to three consecutive weeks, that is your signal to reduce size and investigate before the problem compounds. Metric degradation is an early warning system, not a lagging indicator of failure.
To refine your plan:
- Run a backtest on your last 50 trades using three different stop distances: 0.5x ATR, 1x ATR, and 1.5x ATR. Compare the win rate, drawdown, and expectancy for each.
- Review your monthly P&L against your maximum allowable drawdown. If you are consistently using less than half your weekly loss cap, you may have room to take on slightly more risk per trade.
- Adjust position sizing thresholds when your win rate changes meaningfully. A strategy that used to win 55% of the time but now wins 45% requires smaller sizing to stay profitable.
How to develop risk strategies that actually improve over time comes down to one habit: treating your trading like a business with quarterly performance reviews, not a series of isolated bets.
My honest take on risk management
I have watched traders treat position sizing as an afterthought and drawdown limits as suggestions. Without exception, they either blow up or walk away from trading permanently. In my experience, a survivability-first mindset is not pessimistic. It is the only realistic path to compounding gains over time.
What changed my own trading was not a better indicator or a new strategy. It was the day I accepted that hard daily loss limits were non-negotiable, even when I was sure I could recover in one more trade. I have held through unexpected central bank interventions that moved markets 200 pips in two minutes. The traders who survived those events were not the ones with the best analysis. They were the ones who sized small enough to still be standing afterward.
Correlation risk blindsided me once during a risk-off macro event. I thought I held four uncorrelated positions. I was wrong, and they all moved against me at once. Now I check my correlation matrix before every new entry.
Tracking expectancy monthly transformed my approach from guessing whether my strategy worked to knowing it, with data. The moment expectancy drops two months in a row, I cut size before the drawdown gets deep. That one habit has saved more capital than any single entry technique ever could.
— FX
Put your risk plan into practice with Ollatrade
Reading this guide is the first step. The second is having a platform that actually supports how you want to trade.
Ollatrade gives you the tools to execute everything covered here, from volatility analysis with advanced charting to tight spreads that do not eat into your risk budget before you even start. The platform integrates with MetaTrader 4 so you can build custom risk calculators, set automated stop levels, and run expert advisors that enforce your daily loss limits mechanically. If you are ready to apply these top risk management practices in live markets, explore Ollatrade’s forex trading options with built-in execution controls. The economic calendar and real-time market news tools also help you scale down exposure ahead of major events before volatility spikes catch you off guard.
FAQ
What percentage should I risk per trade?
Most experienced traders risk between 0.25% and 1% of account equity per trade, with beginners starting at the lower end. Conservative defaults cap daily losses at 2% and weekly losses at 4%.
How does correlation affect portfolio risk?
Positions with correlations above 0.7 move together and should be treated as a single combined position for sizing. Holding three highly correlated trades can triple your effective risk without you realizing it.
What is volatility-based position sizing?
It is a method that adjusts your position size based on an instrument’s ATR so that every trade carries the same dollar risk regardless of how volatile the asset is. You divide your risk amount by the ATR-derived stop distance to get your size.
When should I stop trading for the day?
Stop immediately when you reach your daily loss limit, typically 2%–3% of account equity. Log the session, close all positions, and do not re-enter markets until the next session.
How often should I review my risk metrics?
Track stop adherence and maximum drawdown weekly. Review expectancy, win rate, and risk:reward ratio monthly. Adjust your position sizing and risk parameters any time two or more metrics degrade consecutively.